|

GBP/USD Price Analysis: Pound trades at fresh 2020 lows, challenging the 1.2900 figure

  • GBP/USD is under heavy bearish pressure challenging the December lows.
  • The level to beat for bears is the 1.2900 support.
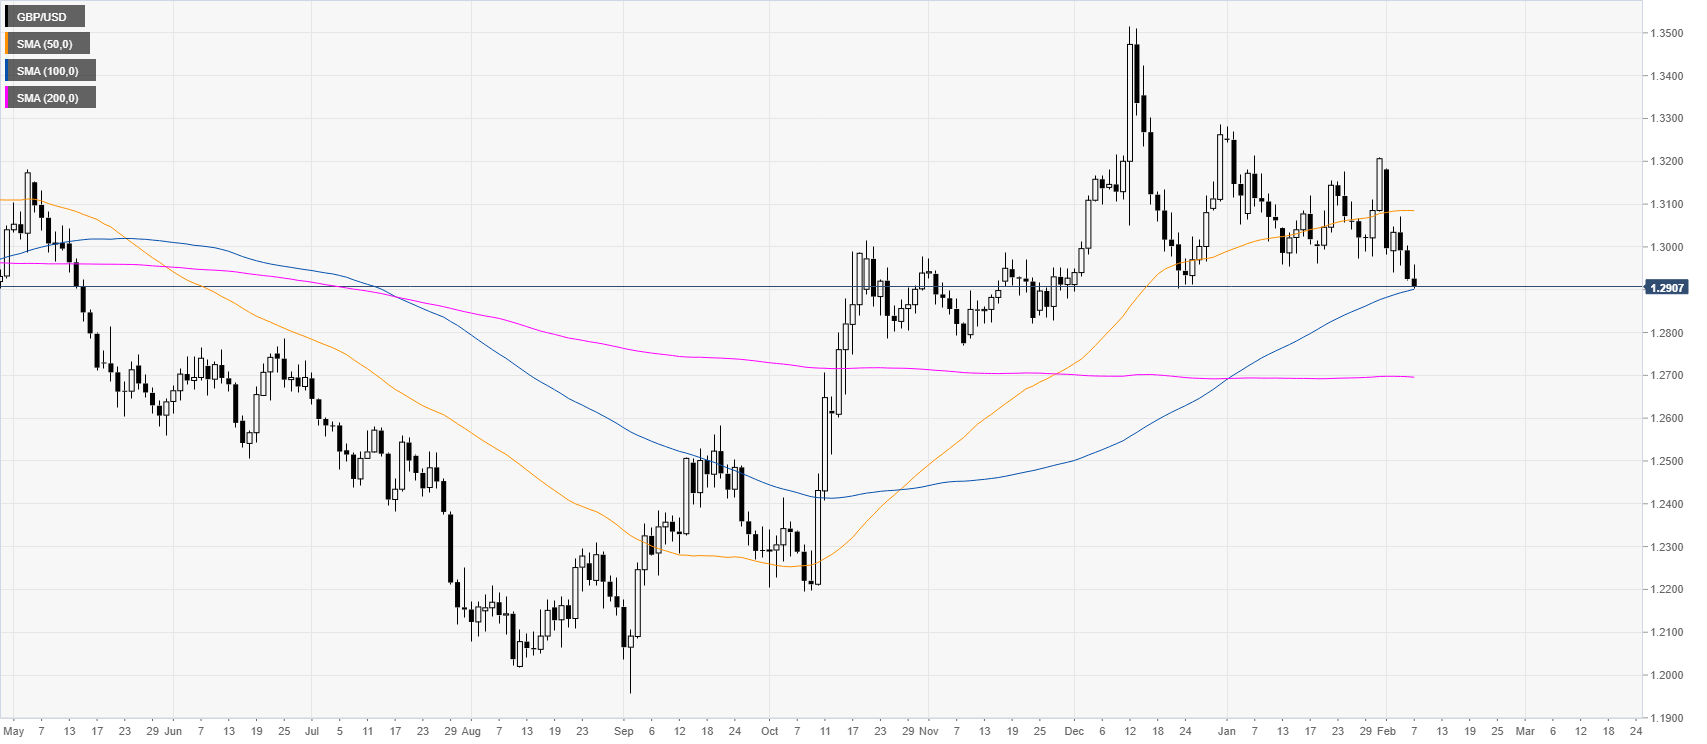
 

GBP/USD daily chart 

 
After the October and December bullish impulses, GBP/USD is trading in a rectangle consolidation above the 100/200-day simple moving averages (SMAs). The NFP came in better than expected at 225K vs 160K forecast by analysts; giving an extra boost to USD. 
 

GBP/USD four-hour chart

 
GBP/USD is under bearish pressure as the spot is trying to break the 1.2900 figure. A break below the above-mentioned level can lead to further weakness towards the 1.2829 figure and the 1.2829 level. Resistances are seen near the 1.2938, 1.2972 level and 1.3000 figure, according to the Technical Confluences Indicator.
 
 
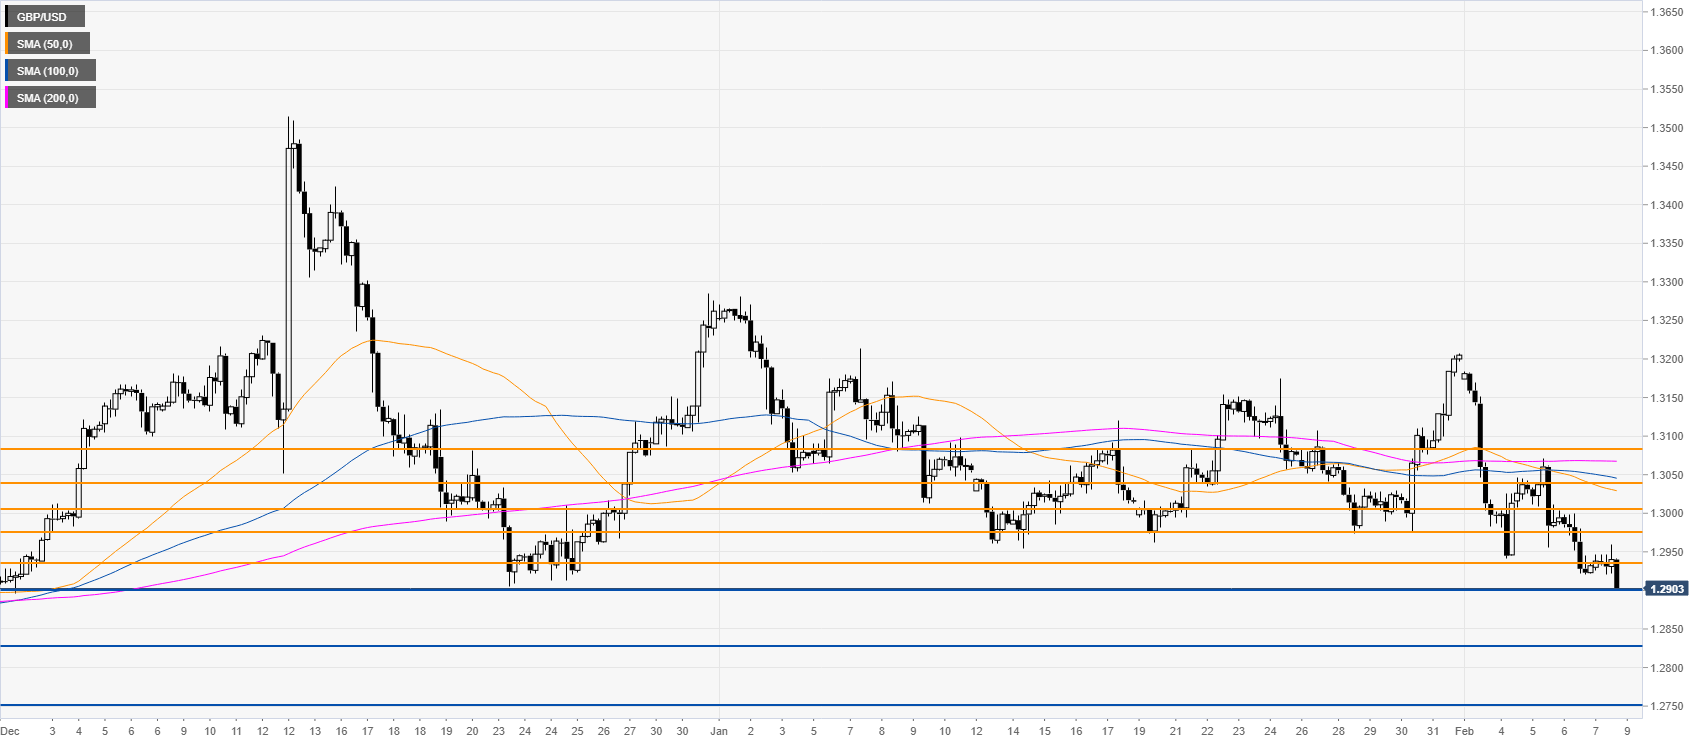
Resistance: 1.2938, 1.2972, 1.3000
Support: 1.2900, 1.2829, 1.2750


Additional key levels

GBP/USD

Overview
Today last price1.2902
Today Daily Change-0.0023
Today Daily Change %-0.18
Today daily open1.2925
 
Trends
Daily SMA201.3045
Daily SMA501.308
Daily SMA1001.2894
Daily SMA2001.2695
 
Levels
Previous Daily High1.3004
Previous Daily Low1.2921
Previous Weekly High1.3207
Previous Weekly Low1.2974
Previous Monthly High1.3281
Previous Monthly Low1.2954
Daily Fibonacci 38.2%1.2953
Daily Fibonacci 61.8%1.2972
Daily Pivot Point S11.2896
Daily Pivot Point S21.2867
Daily Pivot Point S31.2813
Daily Pivot Point R11.2979
Daily Pivot Point R21.3033
Daily Pivot Point R31.3062

Author

Flavio Tosti

Flavio Tosti

Independent Analyst


More from Flavio Tosti
Share:

Editor's Picks

EUR/USD challenges 1.1700, six-week lows

EUR/USD remains under heavy downside pressire in quite a dfrreadful start to the new trading week, putting the 1.1700 support to the test amid the marked rebound in the US Dollar. The flight-so-safety environment continues to support the Greenback following the escalating conflict in the Middle East.

GBP/USD hits new yearly lows near 1.3300

GBP/USD adds to the recent bearish tone, approaching to the key 1.3300 support to reach fresh YTD troughs against the backdrop of the robust performance of the US Dollar. Indeed, Cable’s decline comes amid the firm demand for the safe-haven space in the wake of the US and Israel attacks to Iran.

Gold shifts its attention to $5,600 on fligh-to-safety mood

Gold climbs to levels last seen in late January past the $5,400 mark per troy ounce on Monday. The yellow metal’s strong uptick remains fuelled by incresing geopolitical tensions in the Middle East and the consequent demand for safer assets.

Bitcoin on brink of breakdown amid US-Iran war

Bitcoin (BTC) remains under pressure near the key support level of $65,700. Trading at $66,400 at the time of writing on Monday, a breakdown below this critical level would suggest a deeper correction ahead.

The week ahead: Conflict in the Middle East jolts markets

Events in the Middle East are obviously dominating financial markets this morning. The Brent crude oil price is extending gains and is higher by more than 8%, stock futures are pointing lower and the gold price is higher by more than 2%. 

Pi Network Price Forecast: Core team offloads supply, weighing on PI recovery

Pi Network  hovers below $0.1700, broadly steady at press time on Monday, attempting a recovery after a 2% loss the previous day. Sunday’s decline aligned with nearly 49 million PI tokens offloaded by the Pi Foundation, implying a spike in supply pressure that capped the prevailing four-day recovery.