|

GBP/USD Price Analysis: Pound Sterling looks vulnerable whilst below 1.2665

  • The Pound Sterling holds its rebound from seven-month lows against the US Dollar.
  • GBP/USD stays cautious ahead of Wednesday’s US CPI inflation data.
  • The Pound Sterling faces downside risks, as the daily RSI remains below 50.00.

The Pound Sterling (GBP) is trading on the back foot against the US Dollar (USD), as the GBP/USD pair manages to hold above the 1.2600 level at the start of the week on Monday.

A negative shift in risk sentiment, despite easing Middle East geopolitical tensions, weighs on the higher-yielding Pound Sterling while the US Dollar struggles for traction amid the market’s nervousness ahead of Wednesday’s US Consumer Price Index (CPI) data.

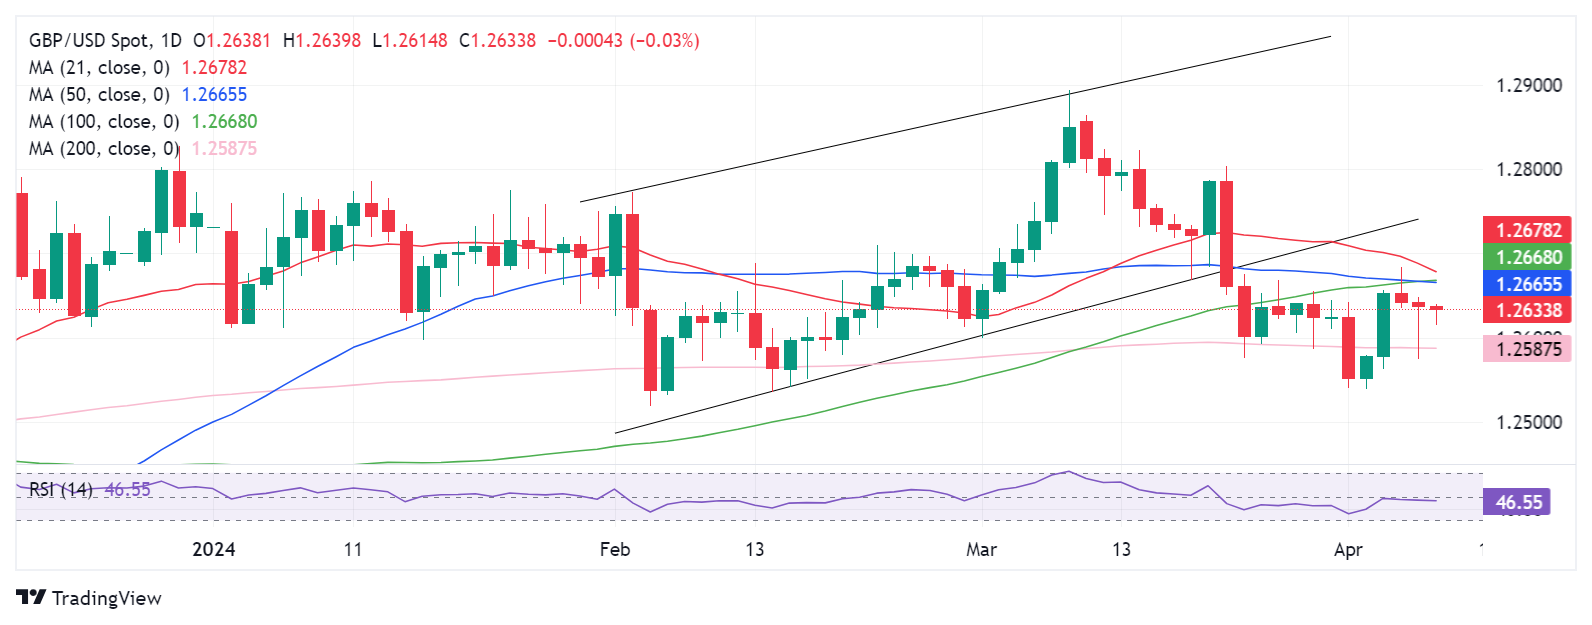
From a short-term technical perspective, GBP/USD remains vulnerable and looks set to extend the downside break from the rising channel seen a couple of weeks ago.

The 14-day Relative Strength Index (RSI) indicator points lower below the midline, currently near 46.50, suggesting that risks remain skewed in favor of sellers.

Pound Sterling sellers, however, need to seek a daily candlestick closing below the horizontal 200-day Simple Moving Average (SMA) at 1.2587 to initiate a sustained downtrend.

The April low near 1.2540 could come to buyers' rescue then, followed by the 1.2500 round figure. Further south,  the 1.2450 static support will challenge the bullish commitments.

If buyers defend the 200-day SMA at 1.2587, it could alleviate the near-term selling pressure, allowing GBP/USD to attempt a comeback toward the static resistance shy of the 1.2700 level. 

GBP/USD must scale the critical confluence resistance at 1.2665 to add extra legs to the rebound toward 1.2700. The 1.2665 level is the intersection of the 100-day and 50-day SMAs.

GBP/USD: Daily chart

GBP/USD

Overview
Today last price1.2632
Today Daily Change-0.0006
Today Daily Change %-0.05
Today daily open1.2638
 
Trends
Daily SMA201.268
Daily SMA501.2667
Daily SMA1001.2667
Daily SMA2001.2588
 
Levels
Previous Daily High1.2649
Previous Daily Low1.2575
Previous Weekly High1.2684
Previous Weekly Low1.2539
Previous Monthly High1.2894
Previous Monthly Low1.2575
Daily Fibonacci 38.2%1.2603
Daily Fibonacci 61.8%1.262
Daily Pivot Point S11.2592
Daily Pivot Point S21.2547
Daily Pivot Point S31.2518
Daily Pivot Point R11.2666
Daily Pivot Point R21.2694
Daily Pivot Point R31.274

Author

Dhwani Mehta

Dhwani Mehta

FXStreet

Residing in Mumbai (India), Dhwani is a Senior Analyst and Manager of the Asian session at FXStreet. She has over 10 years of experience in analyzing and covering the global financial markets, with specialization in Forex and commodities markets.

More from Dhwani Mehta
Share:

Markets move fast. We move first.

Orange Juice Newsletter brings you expert driven insights - not headlines. Every day on your inbox.

By subscribing you agree to our Terms and conditions.

Editor's Picks

EUR/USD struggles for direction amid USD gains

EUR/USD is trimming part of its earlier gains, coming under some mild downside pressure near 1.1730 as the US Dollar edges higher. Markets are still digesting the Fed’s latest rate decision, while also looking ahead to more commentary from Fed officials in the sessions ahead.

GBP/USD drops to daily lows near 1.3360

Disappointing UK data weighed on the Sterling towards the end of the week, triggering a pullback in GBP/USD to fresh daily lows near 1.3360. Looking ahead, the next key event across the Channel is the BoE meeting on December 18.

Gold losses momentum, challenges $4,300

Gold now gives away some gains and disputes the key $4,300 zone per troy ounce following earlier multi-week highs. The move is being driven by expectations that the Fed will deliver further rate cuts next year, with the yellow metal climbing despite a firmer Greenback and rising US Treasury yields across the board.

Litecoin Price Forecast: LTC struggles to extend gains, bullish bets at risk

Litecoin (LTC) price steadies above $80 at press time on Friday, following a reversal from the $87 resistance level on Wednesday. Derivatives data suggests a bullish positional buildup while the LTC futures Open Interest declines, flashing a long squeeze risk.

Big week ends with big doubts

The S&P 500 continued to push higher yesterday as the US 2-year yield wavered around the 3.50% mark following a Federal Reserve (Fed) rate cut earlier this week that was ultimately perceived as not that hawkish after all. The cut is especially boosting the non-tech pockets of the market.

Aave Price Forecast: AAVE primed for breakout as bullish signals strengthen

Aave (AAVE) price is trading above $204 at the time of writing on Friday and approaching the upper boundary of its descending parallel channel; a breakout from this structure would favor the bulls.