|

GBP/USD Price Analysis: Pound corrects from 17-month highs, trades near 1.3330 level

  • The pound is correcting the massive bullish spike triggered by the UK elections. 
  • Support is seen at the 1.3344, 1.3288 and 1.3254 price levels.
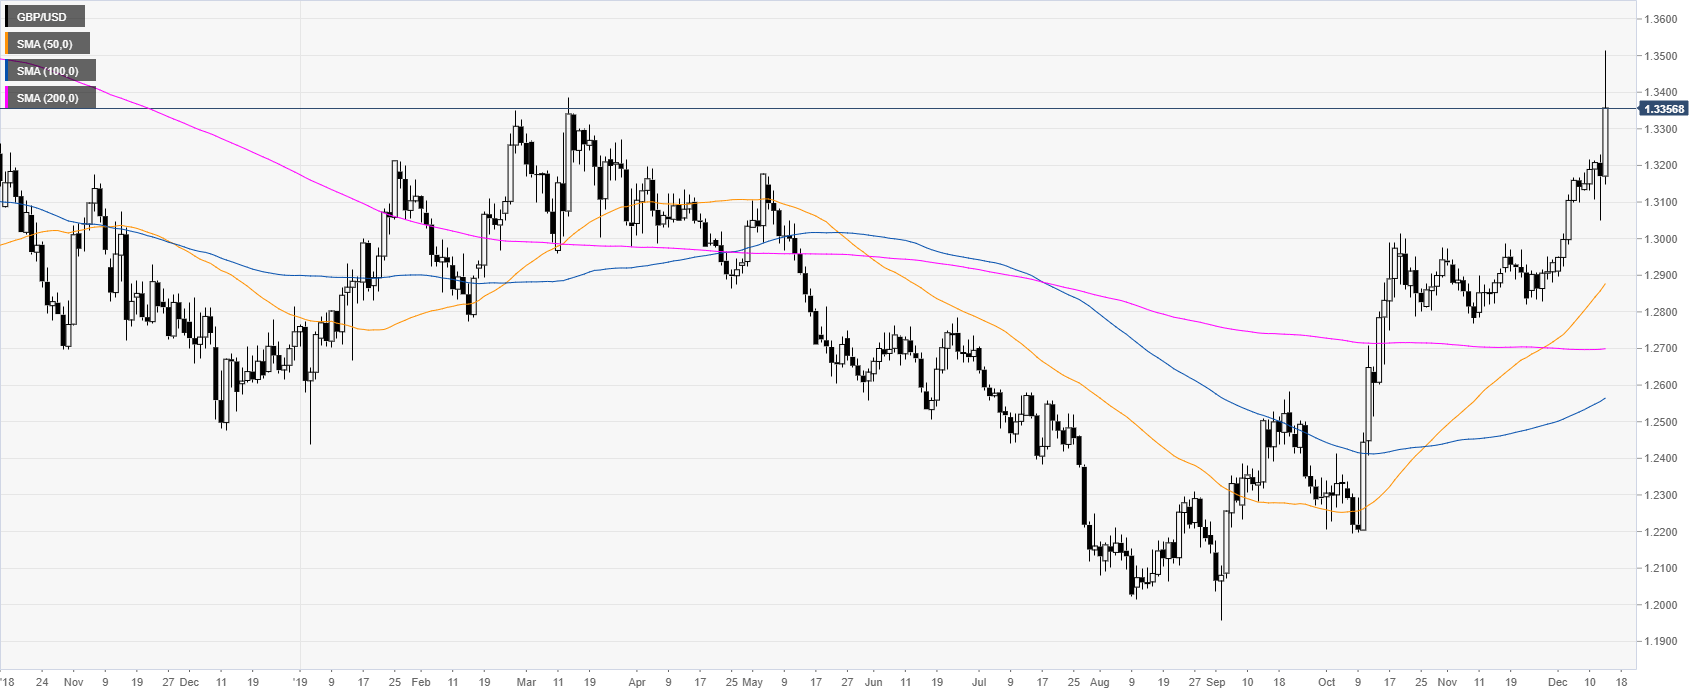


GBP/USD daily chart

 
The market reached 17-month highs as the elections in the UK provided extreme volatility. The underlying trend stays bullish while above the main daily SMAs. 
 

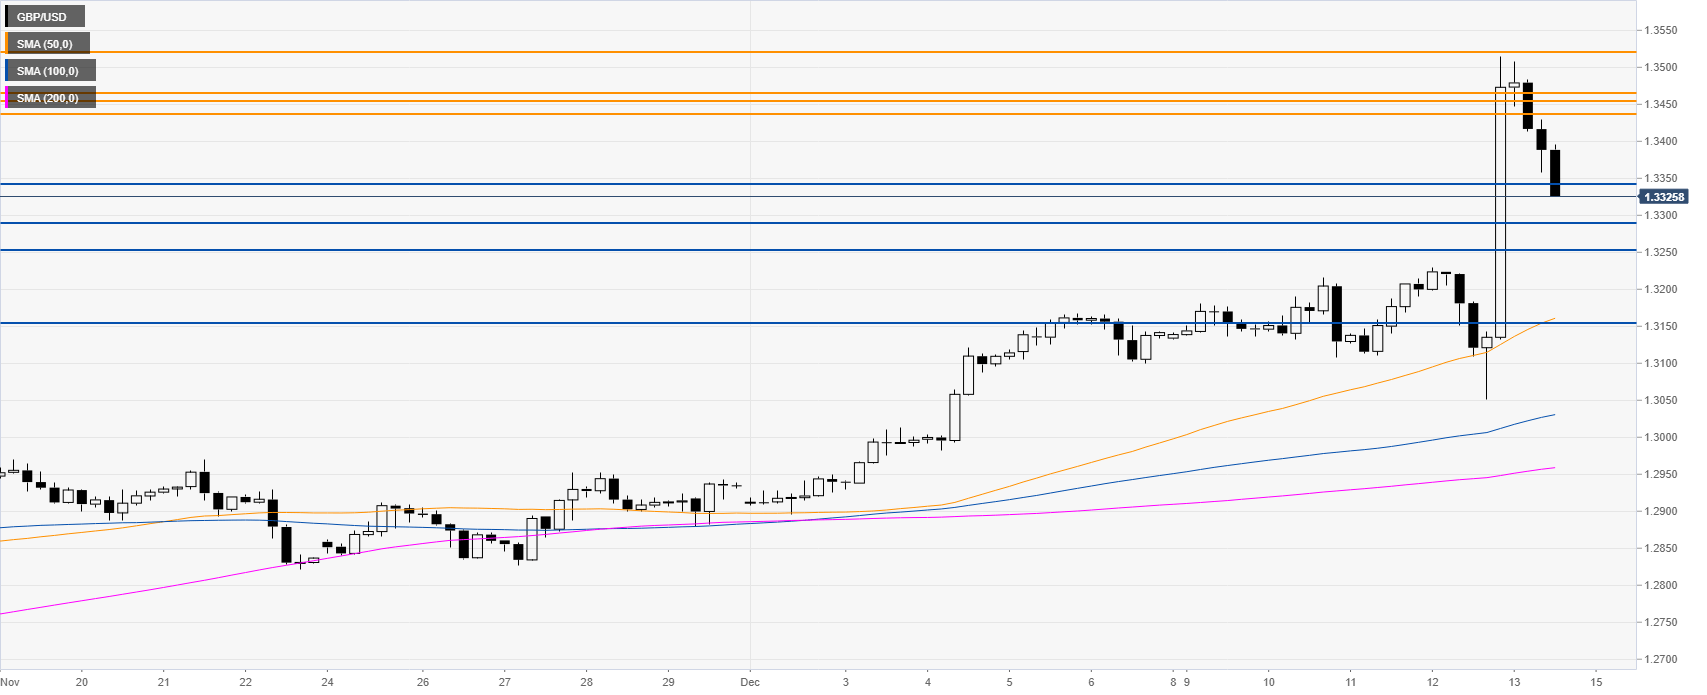
GBP/USD four-hour chart

 
GBP/USD is correcting down after the massive bullish spike. The market is testing the 1.3344 support. If the correction goes on below that level the market could continue to slide towards the 1.3288 and 1.3254 price levels, according to the Technical Confluences Indicator


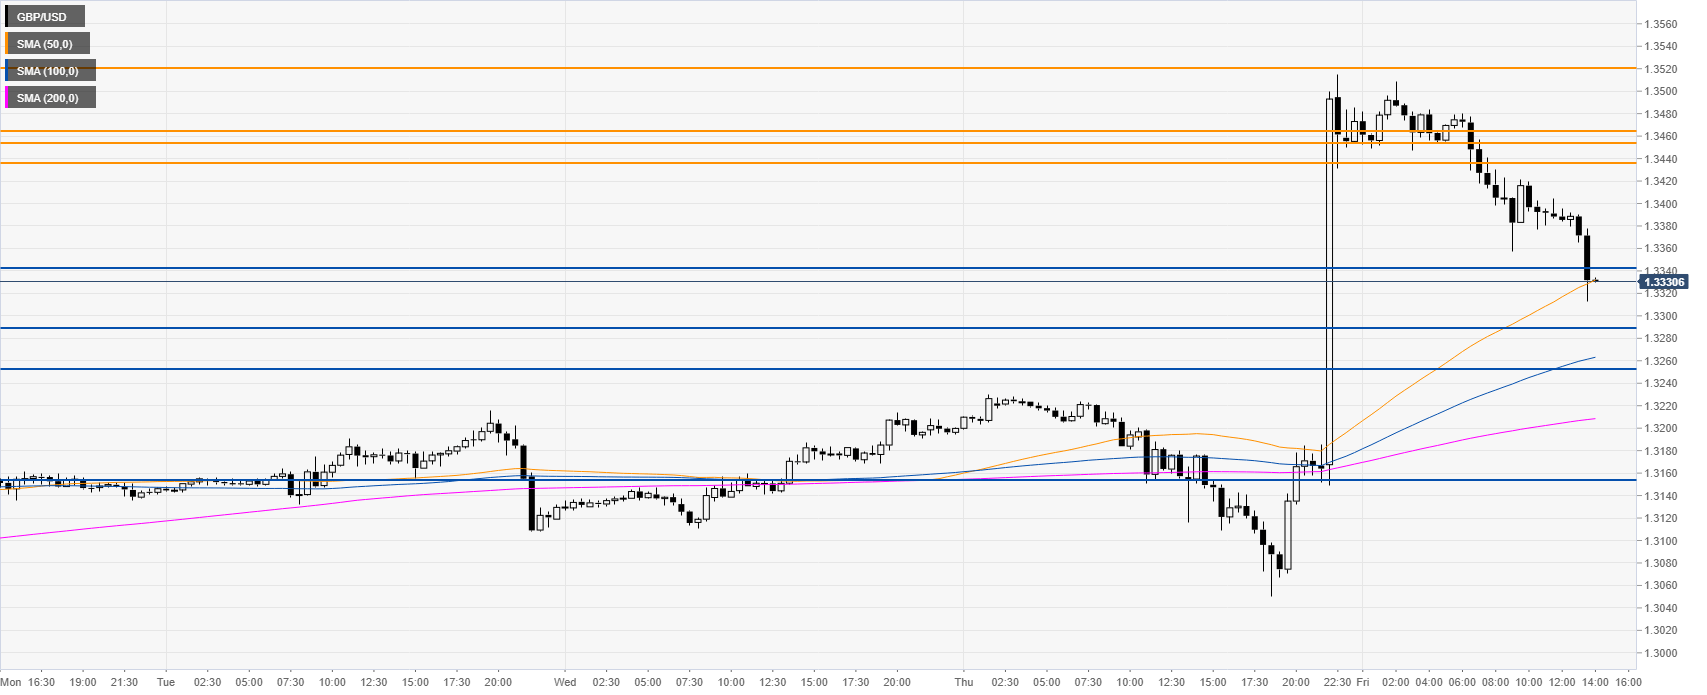
GBP/USD 30-minute chart


The spot is challenging the 50 SMA. Bulls seem to be absent this Friday. Resistance is seen at the 1.3435, 1.3455/62 and 1.3518 levels, according to the Technical Confluences Indicator.
  

Additional key levels

GBP/USD

Overview
Today last price1.3332
Today Daily Change0.0161
Today Daily Change %1.22
Today daily open1.3171
 
Trends
Daily SMA201.3002
Daily SMA501.2857
Daily SMA1001.2555
Daily SMA2001.2698
 
Levels
Previous Daily High1.323
Previous Daily Low1.3051
Previous Weekly High1.3167
Previous Weekly Low1.2896
Previous Monthly High1.2986
Previous Monthly Low1.2769
Daily Fibonacci 38.2%1.3119
Daily Fibonacci 61.8%1.3161
Daily Pivot Point S11.3071
Daily Pivot Point S21.2971
Daily Pivot Point S31.2892
Daily Pivot Point R11.325
Daily Pivot Point R21.333
Daily Pivot Point R31.343

Author

Flavio Tosti

Flavio Tosti

Independent Analyst


More from Flavio Tosti
Share:

Editor's Picks

EUR/USD slumps below 1.1750 as USD benefits from risk-aversion

EUR/USD comes under renewed bearish pressure in the European session and trades below 1.1750 following a recovery attempt earlier in the day. The US Dollar gathers strength and weighs on the pair as investors seek refuge in the wake of Israel and the United States' joint attack on Iran.

GBP/USD targets 1.3500 barrier near moving averages

GBP/USD rebounds from the daily losses, trading around 1.3450 during the Asian hours on Monday. The technical analysis of the daily chart indicates an ongoing bearish bias, as the pair trades within a descending channel pattern.

Gold surges on safe-haven demand, tests $5,400

Gold benefits from intense risk-aversion on Monday and climbs to the $5,400 region, setting a fresh monthly-high in the process. Tensions in the Middle East remain high as Israel and Hezbollah continue to exchange strikes following the US-Israel joint attack on Iran over the weekend.

Bitcoin on brink of breakdown amid US-Iran war

Bitcoin (BTC) remains under pressure near the key support level of $65,700. Trading at $66,400 at the time of writing on Monday, a breakdown below this critical level would suggest a deeper correction ahead.

The week ahead: Conflict in the Middle East jolts markets

Events in the Middle East are obviously dominating financial markets this morning. The Brent crude oil price is extending gains and is higher by more than 8%, stock futures are pointing lower and the gold price is higher by more than 2%. 

Pi Network Price Forecast: Core team offloads supply, weighing on PI recovery

Pi Network  hovers below $0.1700, broadly steady at press time on Monday, attempting a recovery after a 2% loss the previous day. Sunday’s decline aligned with nearly 49 million PI tokens offloaded by the Pi Foundation, implying a spike in supply pressure that capped the prevailing four-day recovery.