- GBP/USD is coming to a peak in a coil which puts to an imminent breakout.
- The emphasis is currently on a test of 1.2080 for the coming sessions.
- If the bears fail to break this level of support, then a meaningful correction to the upside will be on the cards.
GBP/USD remains on the backside of the late September rally's trendline where the pair gained some 20% in the quarter so far, albeit shedding gains to around 3% to the current spot price and consolidation lows of 1.20975. Still, the Pound Sterling is on track for its best quarter in more than 13 years. However, However, GBP/USD remains about 10% lower for the year and the following analysis is going to be through the eyes of the bears.
GBP/USD was last -0.6% having fluctuated in and out of the positive territory on Tuesday, driven by volatility due to the Bank of Japan's (BoJ) surprise tweak to its bond yield control. The BoJ is now allowing long-term interest rates to rise more in a move aimed at easing some of the costs of prolonged monetary stimulus.
This means that the Japanese could be looking to bring assets home, sinking all ships vs. the yen on the forex board. However, the price is now settled back within the volatility between 1.2223 and 1.2084 but it is coiled into a potential breakout peak below 1.2150.
GBP/USD Daily chart
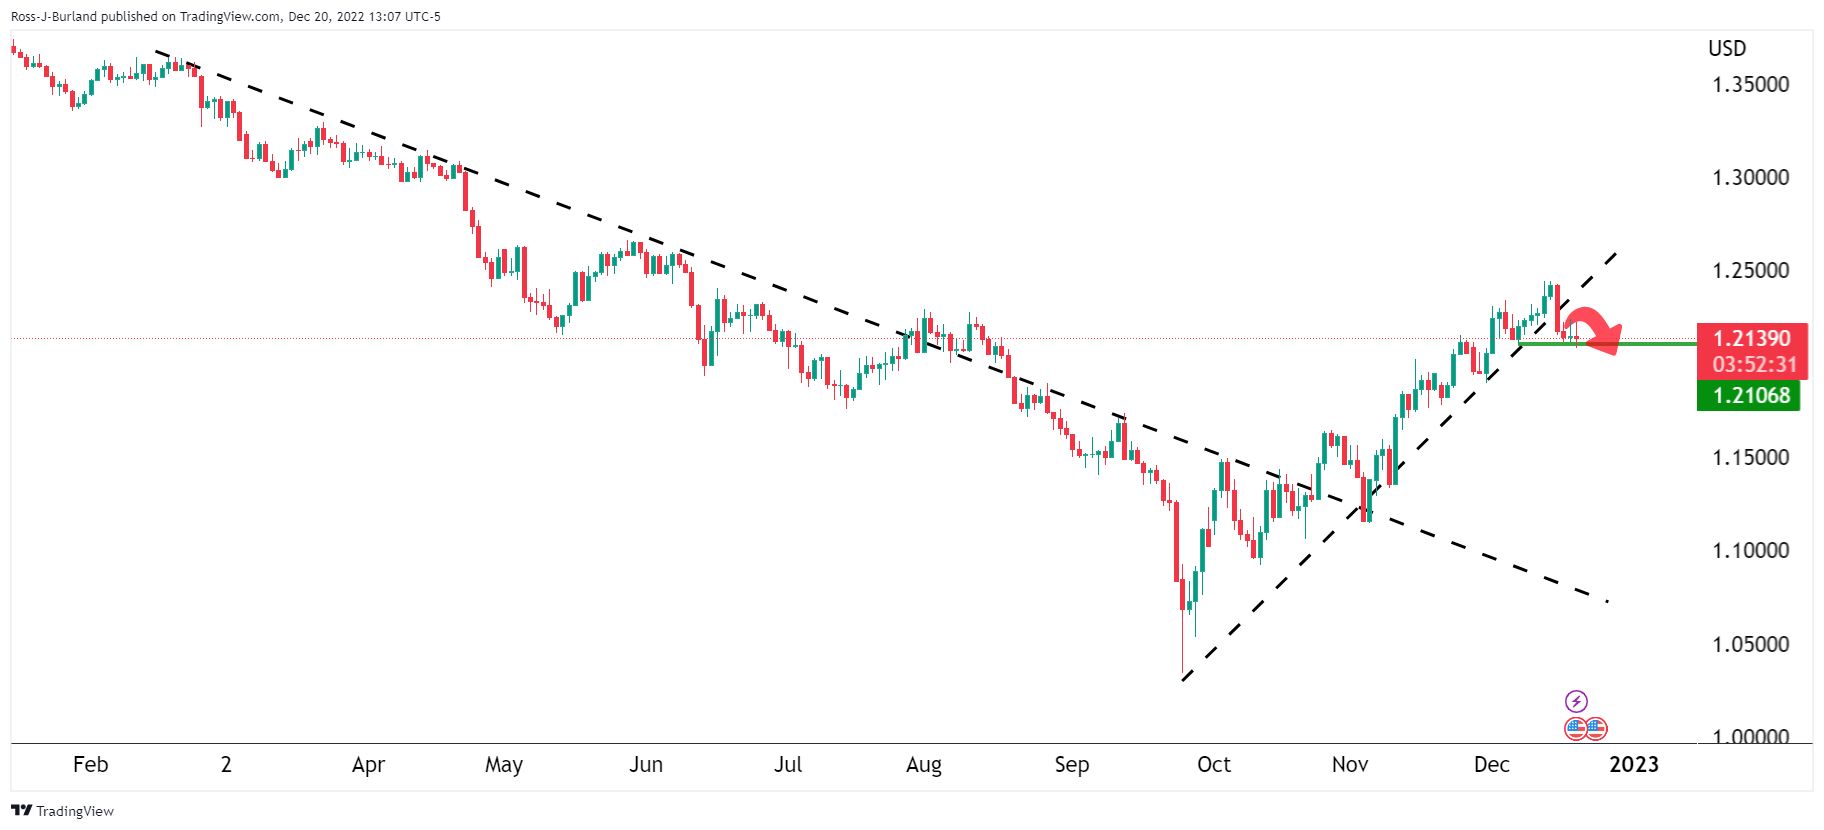
As the images above show, the price is on the backside of the trend and us testing the 1.2100 support. An upside correction into the prior bearish impulse would be expected which eyes 1.2250 resistance that is marked by the volume profile and confluence with the 38.2% Fibonacci retracement as well as the prior structure.
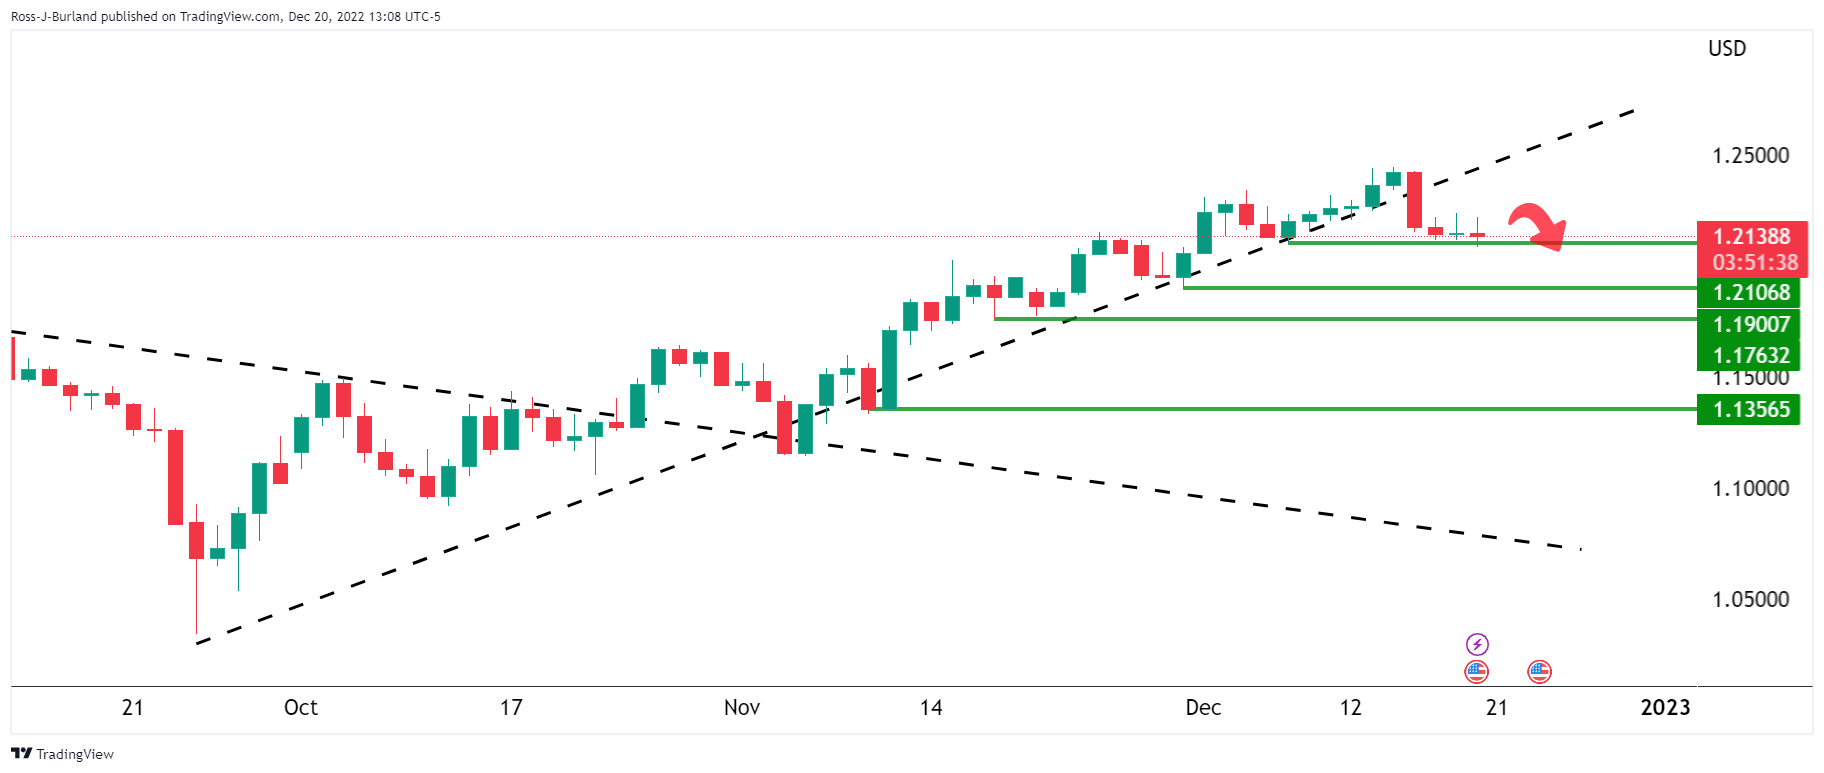
GBP/USD H4 charts
However, moving down to the lower time frames, the bears are flexing and we may have seen the last-ditch effort from the bulls already:
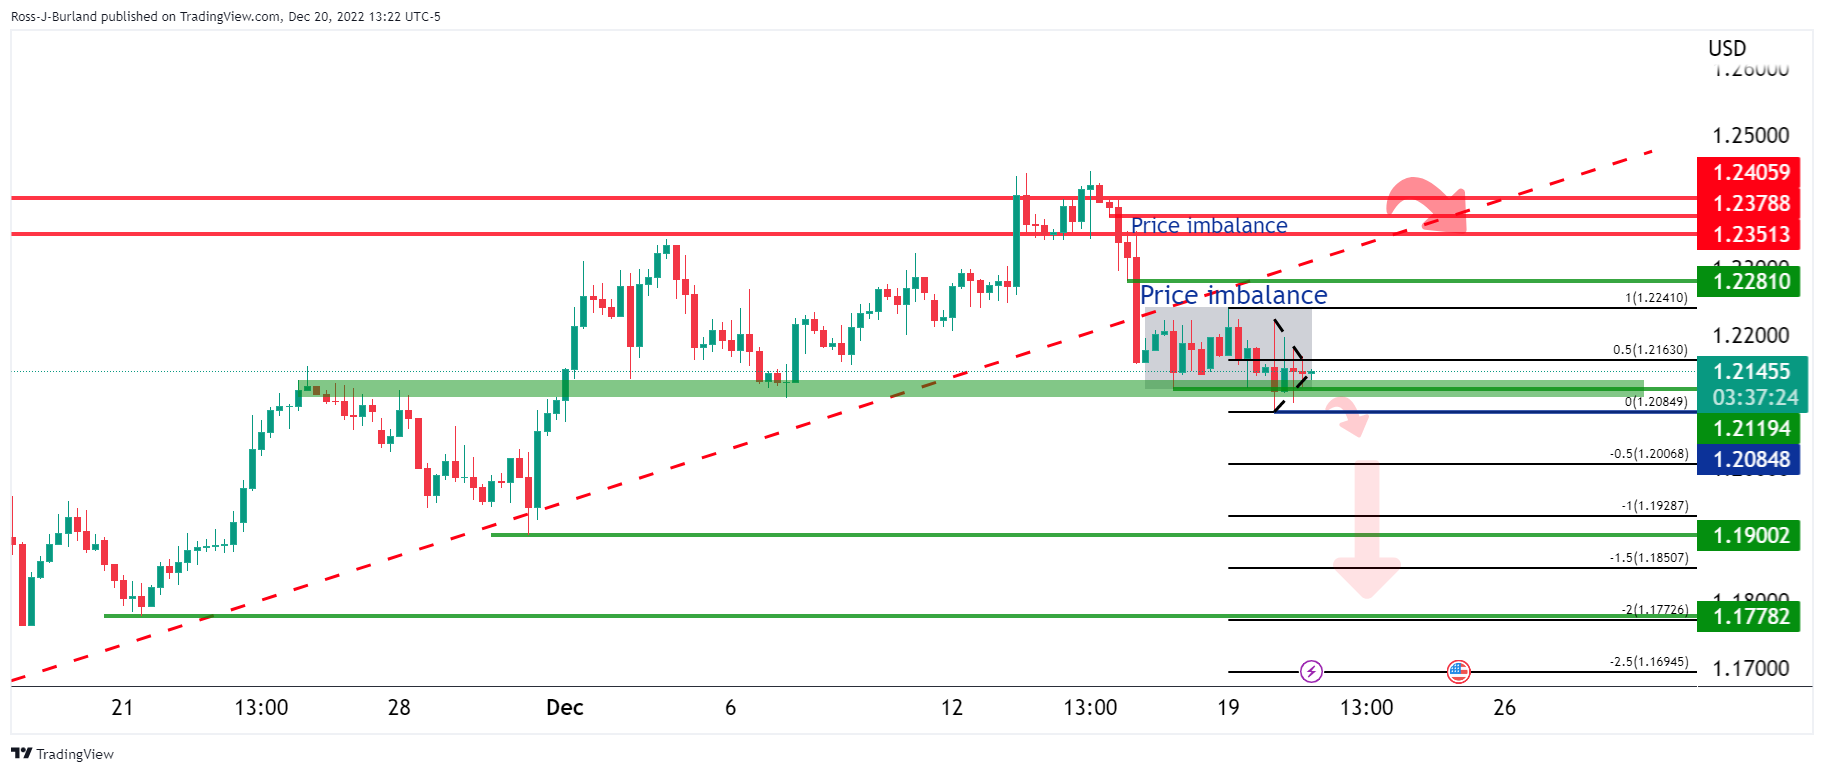
Meanwhile, the coil is coming to a peak and a break out is expected one way or the other. If the price imbalances above are not swept, then the outlook could play out as the above.
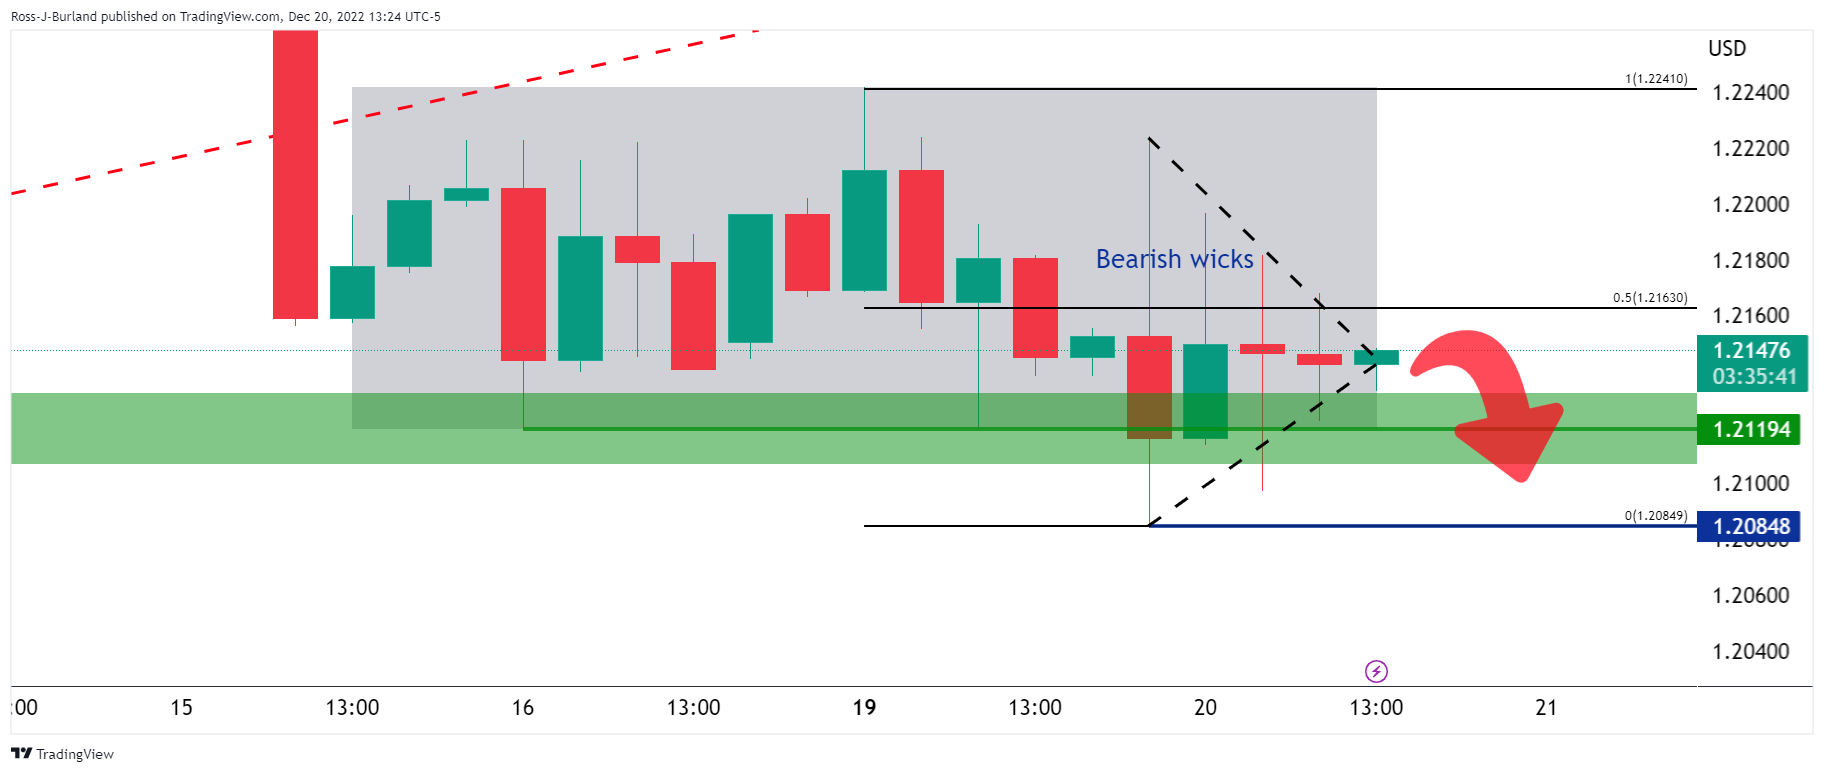
Staying with the bearish bias, the bearish wicks are a compelling feature which puts the emphasis on a test of 1.2080 for the coming sessions. If the bears fail to break this level of support, then a meaningful correction to the upside, as oper the daily chart, has a higher probability of playing out.
Information on these pages contains forward-looking statements that involve risks and uncertainties. Markets and instruments profiled on this page are for informational purposes only and should not in any way come across as a recommendation to buy or sell in these assets. You should do your own thorough research before making any investment decisions. FXStreet does not in any way guarantee that this information is free from mistakes, errors, or material misstatements. It also does not guarantee that this information is of a timely nature. Investing in Open Markets involves a great deal of risk, including the loss of all or a portion of your investment, as well as emotional distress. All risks, losses and costs associated with investing, including total loss of principal, are your responsibility. The views and opinions expressed in this article are those of the authors and do not necessarily reflect the official policy or position of FXStreet nor its advertisers. The author will not be held responsible for information that is found at the end of links posted on this page.
If not otherwise explicitly mentioned in the body of the article, at the time of writing, the author has no position in any stock mentioned in this article and no business relationship with any company mentioned. The author has not received compensation for writing this article, other than from FXStreet.
FXStreet and the author do not provide personalized recommendations. The author makes no representations as to the accuracy, completeness, or suitability of this information. FXStreet and the author will not be liable for any errors, omissions or any losses, injuries or damages arising from this information and its display or use. Errors and omissions excepted.
The author and FXStreet are not registered investment advisors and nothing in this article is intended to be investment advice.
Recommended content
Editors’ Picks

AUD/USD: Gains capped by 0.6300 so far
AUD/USD succumbed to the selling pressure and receded to the 0.6230 zone after briefly piercing the key 0.6300 hurdle on the back of a choppy session in the US Dollar.

EUR/USD looks bid and near 1.0400
EUR/USD extended its weekly recovery and revisited the area above the 1.0400 level, although the move lacked follow through, with the pair eventually slipping back to the 1.0380 region in the wake of the closing bell on Wall Street.

Gold picks up pace above $2,900, Dollar weakens further
Extra selling bias in the Greenback now prompts Gold prices to regain the $2,900 mark per ounce troy and above despite the steady climb in US yields across the board.

BNB price enters 7-day winning streak as Binance liquidates over $5.9 billion from BTC, ETH and SOL holdings
Binance Coin (BNB) price surged past $650 on Wednesday, marking a 15% increase over seven consecutive days of profit. Market reports suggest that recent trades executed by Binance’s parent company could drive further BNB price gains.

How the European Union could counter US tariffs
With Trump ordering a 25% import tax on all steel and aluminium entering the US, trade tensions are inching closer to Europe. We take a closer look at how European policymakers could react. Spoiler alert: it's complicated.

The Best Brokers of the Year
SPONSORED Explore top-quality choices worldwide and locally. Compare key features like spreads, leverage, and platforms. Find the right broker for your needs, whether trading CFDs, Forex pairs like EUR/USD, or commodities like Gold.