GBP/USD Price Analysis: Needs acceptance above 1.2500 for a fresh rally
- GBP/USD has rebounded firmly amid an absence of recovery signs in the auction of the USD Index.
- Investors are ignoring US banking woes and are cheering upbeat quarterly results from the US tech firms, portraying a risk-on mood.
- UK’s new-home buyers market is declining as higher interest rates are making interest obligations less affordable.

The GBP/USD pair has delivered a breakout of the consolidation formed in a range of 1.2453-1.2477 in the early London session. The Cable has rebounded firmly amid further correction by the US Dollar Index (DXY).
S&P500 futures have added significant gains in the Asian session as investors are ignoring fears of US banking and are cheering upbeat quarterly results from United States technology companies. Market mood is improving as the Federal Reserve (Fed) is expected to sound neutral on interest rate guidance after an interest rate hike of 25 basis points (bps).
On the Pound Sterling front, higher interest rates by the Bank of England (BoE) are creating more trouble for households. Persimmon, United Kingdom’s largest domestic property developer, said on Wednesday, the new-home buyers market is declining as higher interest rates are making interest obligations less affordable.
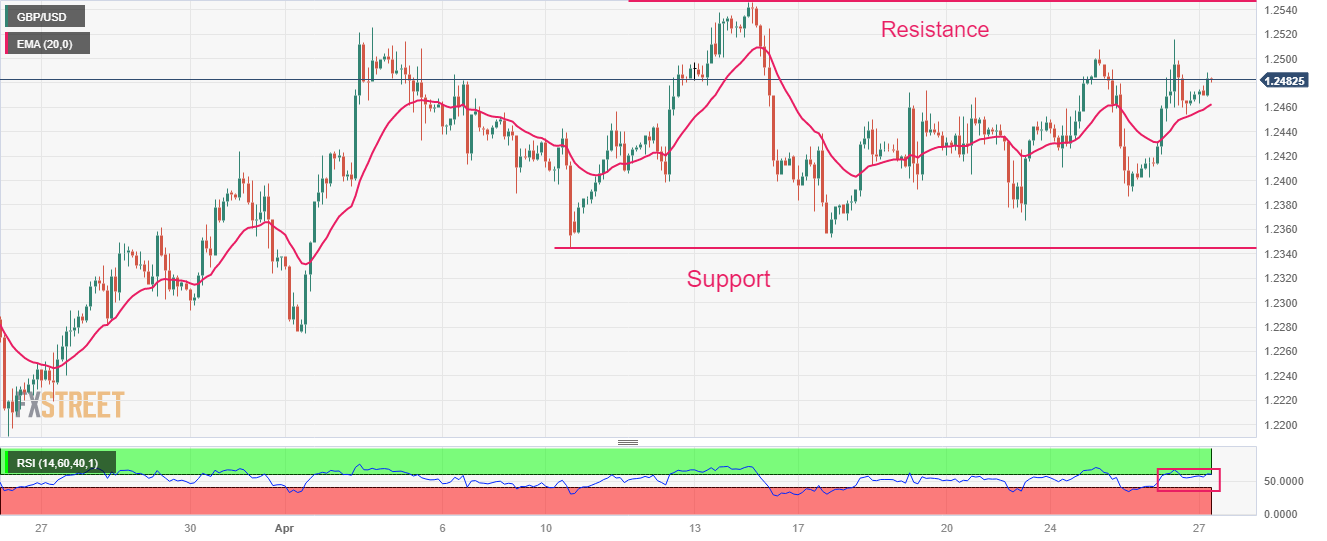
GBP/USD is gyrating in the 200-pip range for more than two weeks. The upside of the Cable is restricted by resistance plotted from April 14 high at 1.2545 while the downside is being supported near April 10 low at 1.2344. The asset is auctioning above the 20-period Exponential Moving Average (EMA) at 1.2463, however, the lack of upside momentum indicates that the upside bias is not strong enough.
Meanwhile, the Relative Strength Index (RSI) (14) has dropped into the 40.00-60.00 range, which conveys that investors are awaiting a critical trigger for further moves.
A decisive move above April 14 high at 1.2545 will drive the asset towards a fresh 10-month high at 1.2597, which is 08 June 2022 high. A breach of the latter will expose the asset to May 27 high at 1.2667.
On the flip side, a slippage below April 10 low at 1.2345 will expose the asset to March 30 low at 1.2294 followed by March 27 low at 1.2219.
GBP/USD two-hour chart
Author

Sagar Dua
FXStreet
Sagar Dua is associated with the financial markets from his college days. Along with pursuing post-graduation in Commerce in 2014, he started his markets training with chart analysis.