|

GBP/USD Price Analysis: Multiple upside hurdles past 1.2700, firmer US Dollar prod Cable buyers

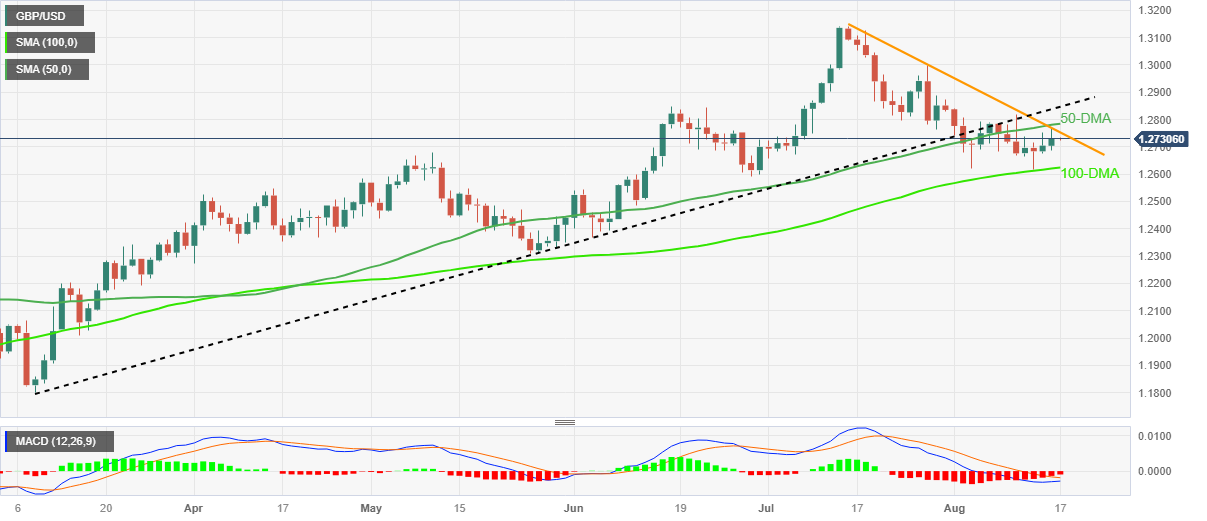
  • GBP/USD defends rebound from 100-DMA at weekly top, prods one-month-old falling resistance line.
  • 50-DMA, multi-day-old previous support line add to the upside filters.
  • Looming bull cross on MACD adds strength to recovery hopes but US Dollar’s strength tests Cable buyers.
  • Late June’s low will challenge Pound Sterling sellers past 100-DMA.

GBP/USD edges higher past 1.2700 as it flirts with the weekly top surrounding 1.2730 amid the early hours of Thursday’s Asian session. In doing so, the Cable pair defends Monday’s U-turn from the 100-DMA while approaching a downward-sloping resistance line from July 14 after a three-day winning streak.

Not only a rebound from the 100-DMA but the impending bull cross on the MACD also underpins the upside bias about the Pound Sterling.

However, a clear break of the stated resistance line, close to 1.2750 by the press time, isn’t an open invitation to the Cable buyers as the 50-DMA hurdle of around 1.2785 prods the short-term advances of the quote.

Following that, a 5.5-month-old previous support line, now resistance around 1.2850, acts as the final defense of the GBP/USD bears.

Meanwhile, the broadly firmer US Dollar, backed by the upbeat Fed Minutes and yields of late, challenge the Pound Sterling buyers and tease a pullback toward the 100-DMA retest, especially amid a light calendar on Thursday. That said, the 100-DMA level is around 1.2625 by the press time.

In a case where the GBP/USD pair remains bearish past 1.2625, the weekly bottom of 1.2616 and the late June trough surrounding 1.2590 will test the sellers before giving them control.

GBP/USD: Daily chart

Trend: Limited upside expected

Additional important levels

Overview
Today last price1.2731
Today Daily Change0.0027
Today Daily Change %0.21%
Today daily open1.2704
 
Trends
Daily SMA201.2789
Daily SMA501.2775
Daily SMA1001.2616
Daily SMA2001.2362
 
Levels
Previous Daily High1.2752
Previous Daily Low1.2675
Previous Weekly High1.2819
Previous Weekly Low1.2666
Previous Monthly High1.3142
Previous Monthly Low1.2659
Daily Fibonacci 38.2%1.2723
Daily Fibonacci 61.8%1.2705
Daily Pivot Point S11.2669
Daily Pivot Point S21.2634
Daily Pivot Point S31.2592
Daily Pivot Point R11.2746
Daily Pivot Point R21.2788
Daily Pivot Point R31.2823

Author

Anil Panchal

Anil Panchal

FXStreet

Anil Panchal has nearly 15 years of experience in tracking financial markets. With a keen interest in macroeconomics, Anil aptly tracks global news/updates and stays well-informed about the global financial moves and their implications.

More from Anil Panchal
Share:

Editor's Picks

EUR/USD seems fragile below 1.1700 as Middle East war boosts energy prices

The EUR/USD pair trades flat at around 1.1680 during the Asian trading session on Tuesday, but broadly seems vulnerable, being close to its five-week low. The major currency pair is under pressure as surging oil prices due to the United States-Israel war with Iran have increased the risks of higher inflation for the Old Continent.

GBP/USD hovers around 1.3400 with bearish pressure intact

GBP/USD edges higher after three days of losses, trading around 1.3400 during the Asian hours on Tuesday. The technical analysis of the daily chart indicates an ongoing bearish bias, as the pair trades within a descending channel pattern.

Gold stays bullish as Iran war continues to spur safe-haven flows

Gold is finding renewed bids in Asian trades on Tuesday, making another attempt to regain the $5,400 level amid persistent demand for safe-haven assets as the Iran war extends. A softer risk tone remains in play as US President Donald Trump continues to threaten deeper escalation to the ongoing war with Iran, warning that a “big wave” is yet to come.

Top Crypto Gainers: Near Protocol, Virtuals Protocol, and Morpho lead market recovery

Near Protocol, Virtuals Protocol, and Morpho are leading the market recovery with double-digit gains over the last 24 hours. Technically, NEAR extends the breakout of the falling channel pattern, VIRTUAL holds above the 50-day EMA, while MORPHO tests a crucial resistance. 

The market is not panicking it is repricing the probability distribution of Oil and time

At the end of the day, markets do not trade morality or geopolitics. They trade transmission channels. And the only channel that truly matters in this maelstrom runs through the price of energy and the time value of money.

Grass 20% bullish breakout defies broader market weakness

Grass (GRASS) is edging up above $0.30 at the time of writing on Monday. The token’s notable 20% intraday surge stands out amid heightened volatility in the broader crypto market.