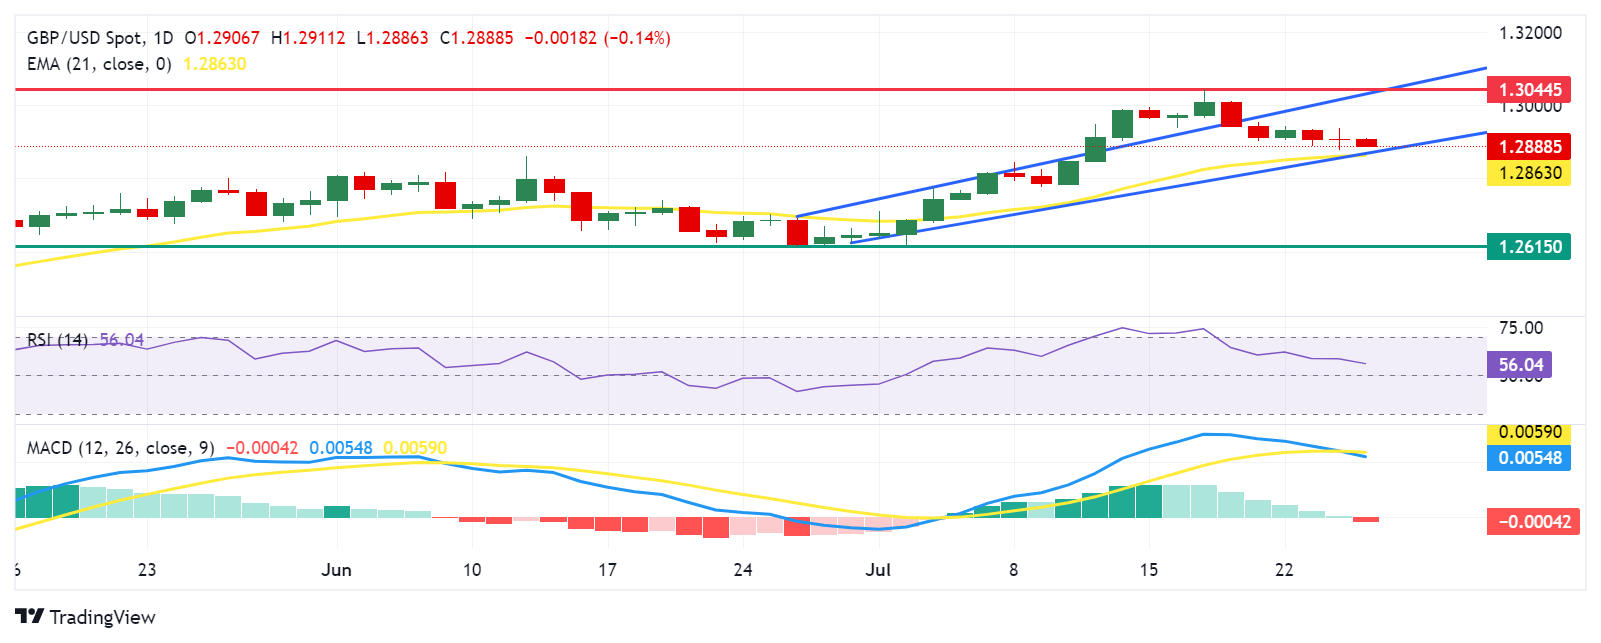
GBP/USD Price Analysis: Moves below 1.2900 toward the lower edge of ascending channel
- GBP/USD could test the lower boundary of the ascending channel and the 21-day EMA at the 1.2863 level.
- The technical analysis suggests a momentum shift as the MACD line has crossed below the signal line.
- A break above the 1.2900 level could lead the pair to approach the upper edge of the ascending channel.

GBP/USD continues to lose ground for the third successive session, trading around 1.2890 during the Asian hours on Thursday. The analysis of the daily chart shows the pair consolidates within an ascending channel, signaling a bullish bias for the pair's price movements.
The Moving Average Convergence Divergence (MACD), a momentum indicator, shows a shift in momentum as the MACD line crosses below the signal line. Despite this, the MACD line remains above the centerline. Observing further movement will help clarify the directional trend. Additionally, the 14-day Relative Strength Index (RSI) sits above the 50 level, suggesting a confirmation of a bullish bias.
On the downside, immediate support seems to be around the lower edge of the ascending channel, coinciding with the 21-day Exponential Moving Average (EMA) at the 1.2863 level. A drop below this support could drive the GBP/USD pair toward the throwback support level of 1.2615.
Regarding resistance, the immediate barrier appears at the psychological level of 1.2900. A break above this level could lead the GBP/USD pair to approach the upper edge of the ascending channel near the key level of 1.3040, followed by the yearly peak of 1.3044 level reached on July 17.
GBP/USD: Daily Chart
British Pound PRICE Today
The table below shows the percentage change of British Pound (GBP) against listed major currencies today. British Pound was the weakest against the Japanese Yen.
| USD | EUR | GBP | JPY | CAD | AUD | NZD | CHF | |
|---|---|---|---|---|---|---|---|---|
| USD | 0.00% | 0.14% | -0.64% | 0.08% | 0.54% | 0.24% | -0.22% | |
| EUR | -0.00% | 0.14% | -0.66% | 0.08% | 0.54% | 0.23% | -0.22% | |
| GBP | -0.14% | -0.14% | -0.77% | -0.06% | 0.42% | 0.10% | -0.36% | |
| JPY | 0.64% | 0.66% | 0.77% | 0.73% | 1.20% | 0.87% | 0.44% | |
| CAD | -0.08% | -0.08% | 0.06% | -0.73% | 0.47% | 0.16% | -0.30% | |
| AUD | -0.54% | -0.54% | -0.42% | -1.20% | -0.47% | -0.29% | -0.77% | |
| NZD | -0.24% | -0.23% | -0.10% | -0.87% | -0.16% | 0.29% | -0.46% | |
| CHF | 0.22% | 0.22% | 0.36% | -0.44% | 0.30% | 0.77% | 0.46% |
The heat map shows percentage changes of major currencies against each other. The base currency is picked from the left column, while the quote currency is picked from the top row. For example, if you pick the British Pound from the left column and move along the horizontal line to the US Dollar, the percentage change displayed in the box will represent GBP (base)/USD (quote).
Author

Akhtar Faruqui
FXStreet
Akhtar Faruqui is a Forex Analyst based in New Delhi, India. With a keen eye for market trends and a passion for dissecting complex financial dynamics, he is dedicated to delivering accurate and insightful Forex news and analysis.


