|

GBP/USD Price Analysis: Looks to build on recovery beyond 1.3700 confluence hurdle

  • GBP/USD witnessed an aggressive short-covering move on Monday amid a broad-based USD weakness.
  • The set-up favours bearish traders, warranting some caution before positioning for any further gains.

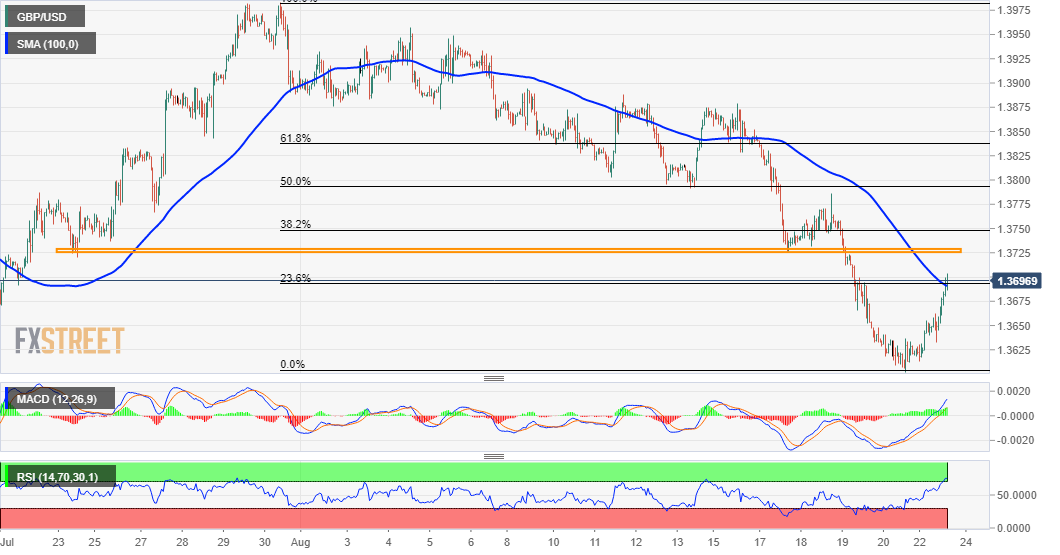
The GBP/USD pair refreshed daily tops heading into the North American session, with bulls looking to build on the momentum further beyond the 1.3700 mark. The mentioned handle coincides with a confluence hurdle, comprising of 100-hour SMA and the 23.6% Fibonacci level of the 1.3984-1.3602 recent leg down. A sustained move beyond will suggest that the pair has formed a temporary base near the 1.3600 mark and prompt some technical buying.

Investors pushed back the likely timing for the Fed's tapering plan amid worries about the economic fallout from the fast-spreading Delta variant of the coronavirus. This, along with the risk-on impulse, weighed on the safe-haven US dollar and provided a goodish lift to the GBP/USD pair. Meanwhile, RSI on the 1-hour chart is already flashing overbought conditions. Moreover, oscillators on the 4-hour chart – though have recovered from the negative zone – are yet to confirm a bullish bias. Adding to this, technical indicators on the daily chart are holding deep in the bearish territory.

This comes on the back of last week's sustained weakness below the 1.3725 horizontal support, which validated a bearish double-top breakdown on the daily chart. The technical set-up still seems tilted in favour of bearish traders, warranting some caution before positioning for any further gains. Hence, any subsequent move up is more likely to confront stiff resistance near the 1.3725 support breakpoint, which now coincides with the 38.2% Fibo. level. That said, some follow-through buying might trigger a fresh bout of the short-covering and push the back towards the 1.3800 mark.

On the flip side, any meaningful pullback now seems to find decent support near the 1.3650 level, below which the GBP/USD pair might aim back to challenge the 1.3600 mark. A convincing break below will be seen as a fresh trigger for bearish traders and prompt aggressive technical selling.  The pair might then turn vulnerable to weaken further below July monthly swing lows support, around the 1.3570 region. The downward trajectory could further get extended and drag the pair towards the next relevant support near the 1.3500 psychological mark.

GBP/USD 1-hour chart

fxsoriginal

Technical levels to watch

GBP/USD

Overview
Today last price1.3691
Today Daily Change0.0069
Today Daily Change %0.51
Today daily open1.3622
 
Trends
Daily SMA201.3839
Daily SMA501.3846
Daily SMA1001.3924
Daily SMA2001.3792
 
Levels
Previous Daily High1.3648
Previous Daily Low1.3602
Previous Weekly High1.3879
Previous Weekly Low1.3602
Previous Monthly High1.3984
Previous Monthly Low1.3572
Daily Fibonacci 38.2%1.362
Daily Fibonacci 61.8%1.3631
Daily Pivot Point S11.36
Daily Pivot Point S21.3578
Daily Pivot Point S31.3554
Daily Pivot Point R11.3646
Daily Pivot Point R21.367
Daily Pivot Point R31.3693

Author

Haresh Menghani

Haresh Menghani is a detail-oriented professional with 10+ years of extensive experience in analysing the global financial markets.

More from Haresh Menghani
Share:

Markets move fast. We move first.

Orange Juice Newsletter brings you expert driven insights - not headlines. Every day on your inbox.

By subscribing you agree to our Terms and conditions.

Editor's Picks

EUR/USD drops to daily lows near 1.1630

EUR/USD now loses some traction and slips back to the area of daily lows around 1.1630 on the back of a mild bounce in the US Dollar. Fresh US data, including the September PCE inflation numbers and the latest read on December consumer sentiment, didn’t really move the needle, so the pair is still on course to finish the week with a respectable gain.

GBP/USD trims gains, recedes toward 1.3320

GBP/USD is struggling to keep its daily advance, coming under fresh pressure and retreating to the 1.3320 zone following a mild bullish attempt in the Greenback. Even though US consumer sentiment surprised to the upside, the US Dollar isn’t getting much love, as traders are far more interested in what the Fed will say next week.

Gold makes a U-turn, back to $4,200

Gold is now losing the grip and receding to the key $4,200 region per troy ounce following some signs of life in the Greenback and a marked bounce in US Treasury yields across the board. The positive outlook for the precious metal, however, remains underpinned by steady bets for extra easing by the Fed.

Crypto Today: Bitcoin, Ethereum, XRP pare gains despite increasing hopes of upcoming Fed rate cut

Bitcoin is steadying above $91,000 at the time of writing on Friday. Ethereum remains above $3,100, reflecting positive sentiment ahead of the Federal Reserve's (Fed) monetary policy meeting on December 10.

Week ahead – Rate cut or market shock? The Fed decides

Fed rate cut widely expected; dot plot and overall meeting rhetoric also matter. Risk appetite is supported by Fed rate cut expectations; cryptos show signs of life. RBA, BoC and SNB also meet; chances of surprises are relatively low.

Ripple faces persistent bear risks, shrugging off ETF inflows

Ripple is extending its decline for the second consecutive day, trading at $2.06 at the time of writing on Friday. Sentiment surrounding the cross-border remittance token continues to lag despite steady inflows into XRP spot ETFs.