|

GBP/USD Price Analysis: Holds position below the major level of 1.2650

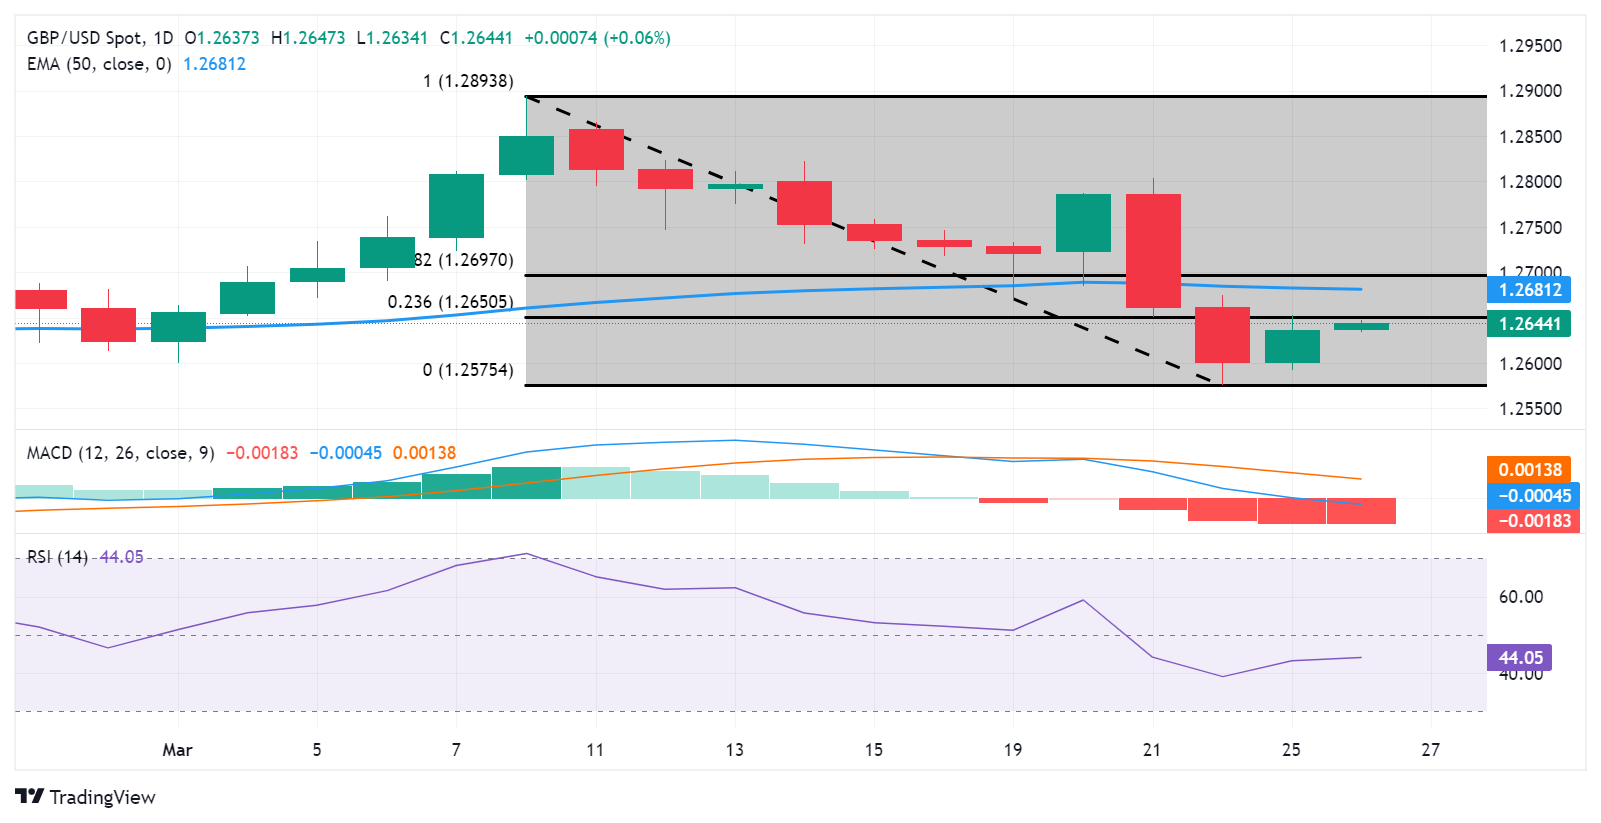
  • GBP/USD could meet the immediate barrier at 23.6% Fibonacci and a major level of 1.2650.
  • Technical analysis suggests a confirmation of a bearish momentum for the pair.
  • The key support could be met around the psychological support level of 1.2600.

GBP/USD attempts to continue gaining ground, advancing to near 1.2640 during the Asian trading hours on Tuesday. The pair could meet the immediate resistance at 23.6% Fibonacci retracement and a major level at 1.2650.

A breakthrough above the latter could exert upward support for the GBP/USD pair to test the 50-day Exponential Moving Average (EMA) at 1.2681. Should the pair surpass these levels, it may approach the psychological barrier of the 1.2700 level.

The technical analysis of the GBP/USD pair shows that the 14-day Relative Strength Index (RSI) is positioned below 50. This indicates a bearish trend for the GBP/USD pair. However, the Moving Average Convergence Divergence (MACD), a lagging indicator, suggests a bearish confirmation for the pair. The MACD line is situated below the centerline but shows divergence below the signal line.

On the downside, the GBP/USD pair may test the psychological support level of 1.2600. If this level is breached, it could prompt the pair to revisit March’s low at 1.2575, followed by the significant level of 1.2550.

GBP/USD: Daily Chart
Author

Akhtar Faruqui

Akhtar Faruqui is a Forex Analyst based in New Delhi, India. With a keen eye for market trends and a passion for dissecting complex financial dynamics, he is dedicated to delivering accurate and insightful Forex news and analysis.


More from Akhtar Faruqui
Share:

Editor's Picks

AUD/USD losses steam at 0.7000 as PMIs signal a deceleration

The Australian Dollar retreats 0.17% against the US Dollar on Thursday as sentiment soured on US tech stocks falling on worries about AI valuations, while Oil surged on an escalation of the US-Iran conflict. The AUD/USD trades at 0.7017.

USD/JPY declines to a one-week low; eyes trading range support near 157.50 on weaker USD

USD/JPY drops to a one-week low during Thursday’s Asian session, with bears now awaiting a break below multi-week range support near mid-157.00s before placing fresh bets amid a broadly weaker US Dollar. Despite bets for a December Fed rate hike and Middle East jitters, the recent decline in US bond yields keeps USD depressed near a three-week low. Moreover, hawkish BoJ expectations and intervention risks underpin the Japanese Yen, further weighing on the currency pair.

Gold falls to two‑month low below $4,050 as oil spikes

Gold price falls to the lowest in more than two months near $4,025 during the early Asian session on Friday. The precious metal faces some selling pressure as escalating tensions in the Middle East send oil surging ahead of a Federal Reserve policy meeting.


Bitcoin falls 4% as chip stocks plunge 6.7% and oil surges
Bitcoin (BTC) fell below $82,000 on Thursday as the crypto market joined a broader market sell-off driven by concerns over artificial intelligence (AI) spending, rising oil prices and escalating geopolitical tensions involving the US and Iran. The top crypto fell 4% to $81,130 as macro fears weighed on prices across the digital asset market.
The Bank of England just got its clearest reason to hike. Here's what it's really watching

UK inflation as measured by the CPI accelerated to 3.5% YoY in September, up from 3.1% in August, according to the Office for National Statistics. This is the highest level since October 2025, exceeding economists' expectations of 3.4% and pushing inflation further from the BoE's 2% target.

What November 3 means for the Fed's rate path and the US Dollar

The USD faces a decisive period ahead of the November 3 midterm elections. While markets anticipate another interest rate increase from the Fed in December, the battle for control of Congress could reshape fiscal policy expectations and, indirectly, the path of US monetary policy in 2027.