|

GBP/USD Price Analysis: Flirts with three-week lows, around 1.3785-80 area

  • GBP/USD witnessed heavy selling on Tuesday and slipped back below the 1.3800 mark.
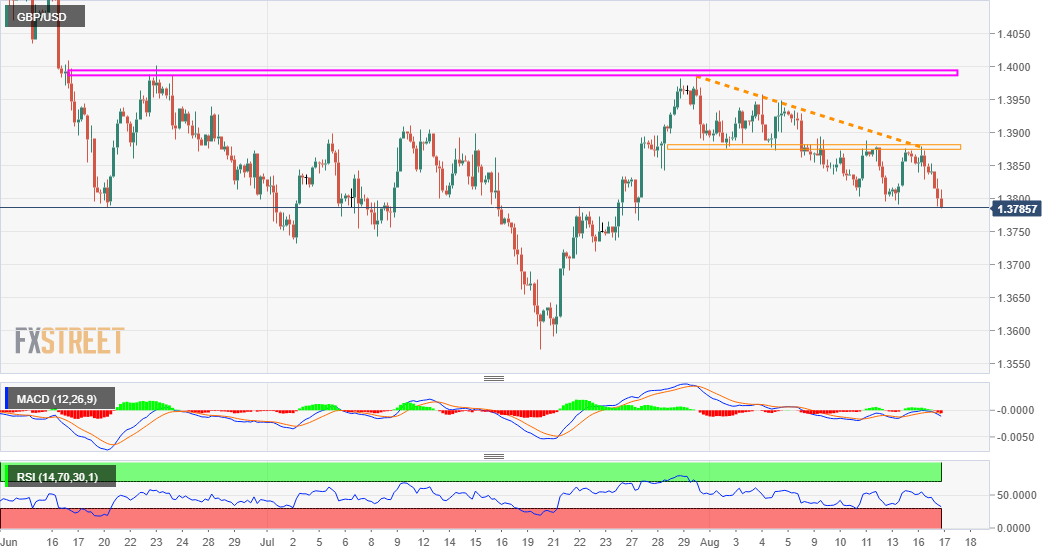
  • Descending triangle breakdown and the formation of double-top favours bearish traders.
  • A sustained move beyond the 1.3875-80 resistance is needed to negate the bearish bias.

The GBP/USD pair extended the previous day's pullback from the 1.3875-80 resistance zone and witnessed some selling for the second consecutive day. The downward momentum dragged the pair to three-week lows, around the 1.3785 region during the first half of the European session.

Looking at the technical picture, the recent pullback from the vicinity of the 1.4000 psychological mark constituted the formation of a bearish double-top on the daily chart. This, along with the overnight rejection near a descending triangle support breakpoint, supports prospects for a further near-term depreciating move.

Meanwhile, technical indicators on the daily chart have just started drifting into the bearish territory and add credence to the near-term negative outlook for the GBP/USD pair. Hence, some follow-through weakness towards the 1.3730-25 intermediate support zone, en-route the 1.3700 mark, remains a distinct possibility.

Some follow-through selling below the 1.3675 horizontal level will turn the GBP/USD pair vulnerable to accelerate the downfall towards the 1.3625 region. This is closely followed by the 1.3600 mark and multi-month lows, around the 1.3570 region touched on July 20, which if broken will be seen as a fresh trigger for bearish traders.

On the flip side, any meaningful recovery attempt beyond the 1.3800 mark might confront stiff resistance and meet with some fresh supply near the 1.3840-50 region. This, in turn, should continue to cap the GBP/USD pair near the 1.3875-80 strong barrier, which if cleared might negate the near-term negative bias.

GBP/USD 4-hour chart

fxsoriginal

Technical levels to watch

GBP/USD

Overview
Today last price1.3798
Today Daily Change-0.0046
Today Daily Change %-0.33
Today daily open1.3844
 
Trends
Daily SMA201.3844
Daily SMA501.3882
Daily SMA1001.3928
Daily SMA2001.3782
 
Levels
Previous Daily High1.3879
Previous Daily Low1.3828
Previous Weekly High1.3894
Previous Weekly Low1.3791
Previous Monthly High1.3984
Previous Monthly Low1.3572
Daily Fibonacci 38.2%1.3847
Daily Fibonacci 61.8%1.3859
Daily Pivot Point S11.3822
Daily Pivot Point S21.38
Daily Pivot Point S31.3771
Daily Pivot Point R11.3873
Daily Pivot Point R21.3901
Daily Pivot Point R31.3924

Author

Haresh Menghani

Haresh Menghani is a detail-oriented professional with 10+ years of extensive experience in analysing the global financial markets.

More from Haresh Menghani
Share:

Editor's Picks

EUR/USD faces some resistance near 100-SMA on H4, around 1.1830 zone

The EUR/USD pair gains some follow-through positive traction for the second consecutive day and climbs to the 1.1830 region during the Asian session on Thursday. The US Dollar remains on the back foot amid concerns about the economic fallout from US President Donald Trump's erratic trade policies and acts as a tailwind for spot prices.

GBP/USD extends recovery to near 20-day EMA as US Dollar weakens

The Pound Sterling holds onto weekly gains around 1.3565 against the US Dollar during the Asian trading session on Thursday. The GBP/USD pair trades firmly as the US Dollar remains under pressure due to uncertainty surrounding the United States trade policy outlook.

Gold looks to build on strength beyond $5,200, eyes monthly peak amid safe-haven flows

Gold touches a fresh daily high heading into the European session on Thursday, with bulls looking to build on the momentum beyond the $5,200 mark. This marks the second straight day of a positive move and is supported by sustained safe-haven flows, bolstered by uncertainties surrounding US President Donald Trump's trade policies and US-Iran nuclear talks.

Stellar: Relief bounce fades as bearish undertone persists

Stellar is trading around $0.16 at the time of writing on Thursday after rebounding more than 8% in the previous day. Derivatives data paints a negative picture as XLM’s short bets hit a monthly high while Open Interest continues to decline.

Nvidia delivers another monster earnings report, and forecasts big things to come

It was another monster earnings report from Nvidia for fiscal Q4. Revenues were $68.1bn, smashing estimates of $65bn. Gross profit margin was a healthy 75%, up from 73.5% in the prior quarter, and the outlook for this quarter was monstrous.

Solana strikes key resistance with double-digit gains

Solana trades at $88 at press time on Thursday, after an 11% upswing the previous day within a broader consolidation range of roughly three weeks. Institutional demand for Solana heightens as US spot SOL Exchange Traded Funds record $30 million of inflow on Wednesday.