GBP/USD Price Analysis: Flat-lines above 1.2600 mark, bullish potential intact
- GBP/USD oscillates in a narrow trading band below the one-year high touched on Monday.
- The ascending trend channel points to a well-established uptrend and favours bullish traders.
- Traders now seem reluctant ahead of the US CPI on Wednesday and the BoE on Thursday.

The GBP/USD pair struggles to gain any meaningful traction and seesaws between tepid gains/minor losses through the early European session on Tuesday. The pair is currently placed around the 1.2620 region and remains well within the striking distance of a one-year high touched the previous day.
The US Dollar (USD) gains some positive traction for the second successive day amid easing fears of a full-blown banking crisis in the US and turns out to be a key factor acting as a headwind for the GBP/USD pair. Apart from this, a generally weaker tone around the equity markets further benefits the safe-haven buck, though speculations that the Federal Reserve (Fed) is nearing the end of its rate-hiking cycle caps the upside.
This, along with bets that the Bank of England (BoE) will hike interest rates by another 25 bps later this week, underpins the British Pound and acts as a tailwind for the GBP/USD pair. Traders also seem reluctant to place aggressive bets ahead of the release of the latest US consumer inflation figures on Wednesday and the key central bank event risk, the highly-anticipated BoE monetary policy meeting on Thursday.
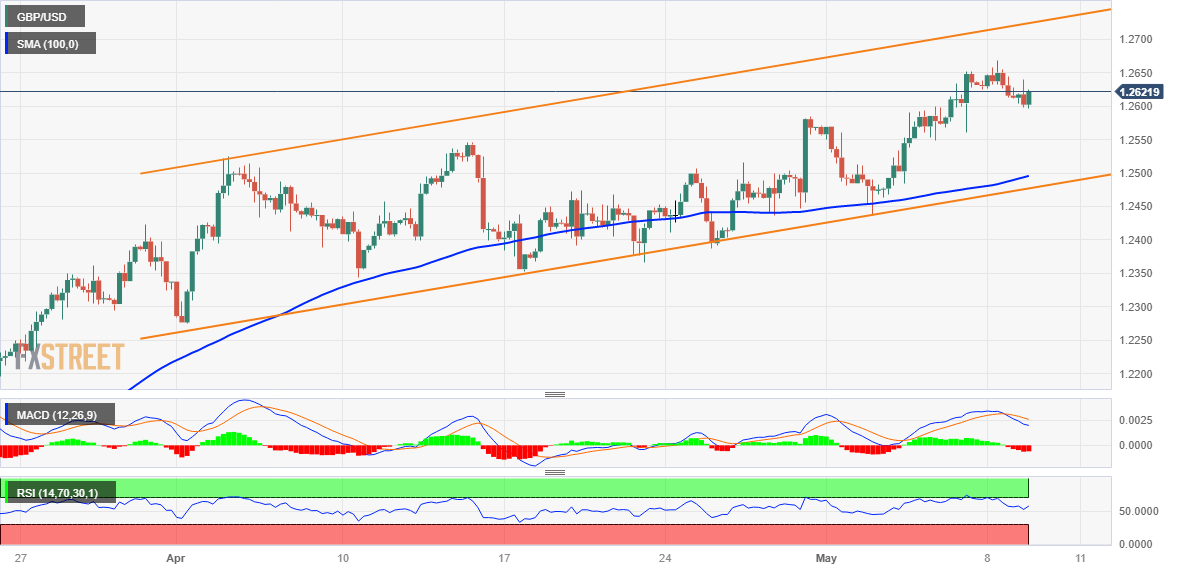
From a technical perspective, the GBP/USD pair on Monday faced rejection near a resistance marked by the top end of an upward-sloping channel. That said, the subsequent slides show some resilience below the 1.2600 mark. This, in turn, reaffirms a well-established short-term uptrend. The constructive setup is reinforced by bullish oscillators on the daily chart, which are still far from being in the overbought territory.
The aforementioned technical setup supports prospects for a further near-term appreciating move. Traders, however, might wait for a breakout through the trend-channel resistance, currently around the 1.2670-1.2675 region, before placing fresh bets. The GBP/USD pair might then aim to surpass the 1.2700 mark and accelerate the momentum towards the next relevant hurdle near the 1.2775-1.2780 region en route to the 1.2800 round figure.
On the flip side, weakness below the 1.2600 mark is likely to attract some buyers near the 1.2565-1.2560 horizontal support. However, some follow-through selling could make the GBP/USD pair vulnerable to sliding towards the 1.2500 psychological mark, which coincides with the 100-period Simple Moving Average (SMA) on the 4-hour chart. Spot prices could eventually drop to the ascending channel support, currently around the 1.2465 area.
GBP/USD 4-hour chart
Key levels to watch
Author

Haresh Menghani
FXStreet
Haresh Menghani is a detail-oriented professional with 10+ years of extensive experience in analysing the global financial markets.

















