|

GBP/USD Price Analysis: Finds resistance around 1.2400 amid Fed-BoE policy-inspired volatility

  • GBP/USD has dropped after facing barricades around 1.2400 despite the upbeat market mood.
  • Volatility to remain squeezed ahead of the Fed-BoE interest rate policy.
  • An oscillation by the RSI (14) in the 40.00-60.00 range indicates a consolidation head.

The GBP/USD pair has sensed selling interest near the round-level resistance of 1.2400 in early Asia after a gradual upside move. The cable is expected to remain on the tenterhooks as investors are shifting their focus toward the announcement of the interest rate decision by the Federal Reserve (Fed) and the Bank of England (BoE) this week.

Meanwhile, the risk appetite of the market participants has been improved after a decline in the United States core Personal Consumption Expenditure (PCE) price index (Dec), which signified that the overall demand is softening along with inflationary pressures. The US Dollar Index (DXY) is continuously declining from its capped upside around 101.80.

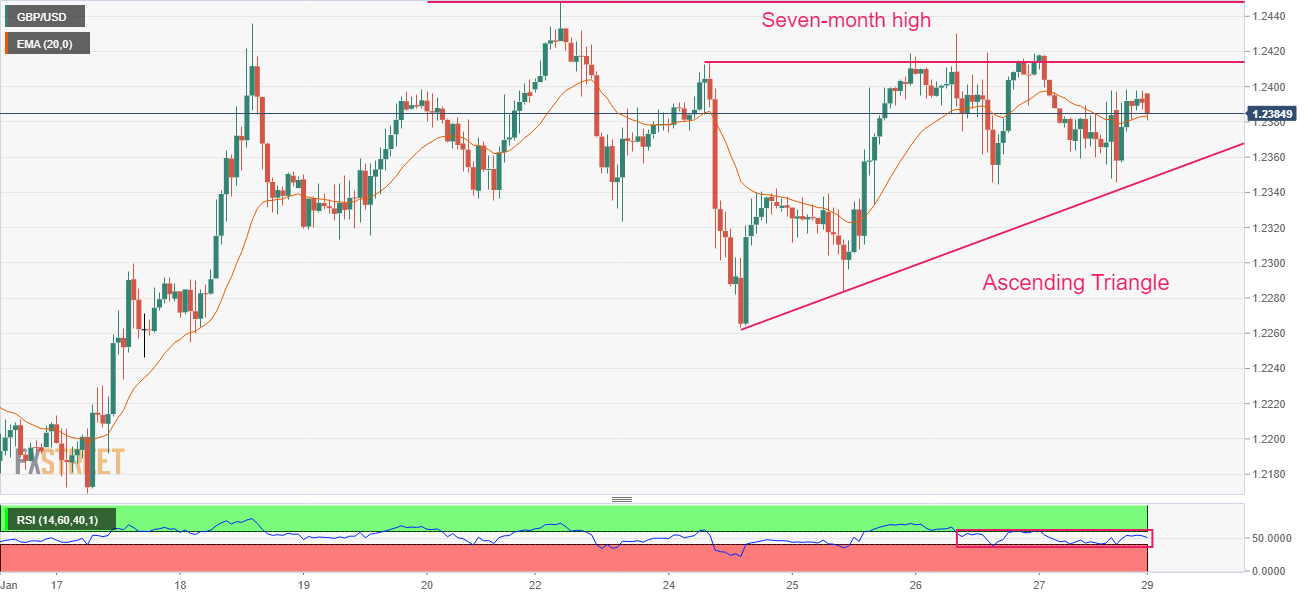
On an hourly scale, GBP/USD is auctioning in an Ascending Triangle chart pattern, which indicates a slippage in volatility. The rationale behind the volatility contraction should be the monetary policy announcements by the Fed and the BoE this week. The upward-sloping trendline of the above-mentioned chart pattern is plotted from January 24 low at 1.2263 while the horizontal resistance is placed from January 24 high around 1.2414.

The 20- period Exponential Moving Average (EMA) at 1.2382 is overlapping the cable, which indicates consolidation ahead.

Also, the Relative Strength Index (RSI) (14) is oscillating in a 40.00-60.00 range, which indicates an absence of a potential trigger for a decisive move.

Should the Cable break above the seven-month high of 1.2448 decisively, Pound Sterling bulls will drive the asset towards the psychological resistance of 1.2500 and the June 7 high around 1.2600.

The Cable will display a sheer downside if it drops below Monday’s low at 1.2171 as it will drag the major toward January 11 low at 1.2100 followed by the psychological support at 1.2000.

GBP/USD hourly chart

GBP/USD

Overview
Today last price1.2388
Today Daily Change-0.0003
Today Daily Change %-0.02
Today daily open1.2391
 
Trends
Daily SMA201.2226
Daily SMA501.2163
Daily SMA1001.1766
Daily SMA2001.1963
 
Levels
Previous Daily High1.2419
Previous Daily Low1.2346
Previous Weekly High1.2448
Previous Weekly Low1.2263
Previous Monthly High1.2447
Previous Monthly Low1.1992
Daily Fibonacci 38.2%1.2374
Daily Fibonacci 61.8%1.2391
Daily Pivot Point S11.2351
Daily Pivot Point S21.2312
Daily Pivot Point S31.2278
Daily Pivot Point R11.2425
Daily Pivot Point R21.2459
Daily Pivot Point R31.2498

Author

Sagar Dua

Sagar Dua

FXStreet

Sagar Dua is associated with the financial markets from his college days. Along with pursuing post-graduation in Commerce in 2014, he started his markets training with chart analysis.

More from Sagar Dua
Share:

Markets move fast. We move first.

Orange Juice Newsletter brings you expert driven insights - not headlines. Every day on your inbox.

By subscribing you agree to our Terms and conditions.

Editor's Picks

EUR/USD gathers recovery momentum, trades near 1.1750

Following the correction seen in the second half of the previous week, EUR/USD gathers bullish momentum and trades in positive territory near 1.1750. The US Dollar (USD) struggles to attract buyers and supports the pair as investors await Tuesday's GDP data ahead of the Christmas holiday. 

GBP/USD knocks ten-week highs ahead of holiday slowdown

GBP/USD found room on the high side on Monday, kicking off a holiday-shortened trading week with a fresh spat of Greenback weakness, bolstering the Pound Sterling into its highest bids in ten weeks. Pound traders are largely brushing off the latest interest rate cut from the Bank of England as the UK’s central bank policy strategy leaves the water murky for rate-cut watchers.

Gold buying remains unabated; fresh all-time peak and counting

Gold builds on the previous day's blowout rally through the $4,400 mark and continues scaling new record highs through the Asian session on Tuesday. Bets for more interest rate cuts by the US Fed, renewed US Dollar selling bias, and rising geopolitical uncertainties turn out to be key factors driving flows towards the bullion. Traders now look to the delayed release of the revised US Q3 GDP print and US Durable Goods Orders for a fresh impetus.

Year ahead 2026: Where will Bitcoin be in a year’s time?

Bitcoin, which accounts for roughly 60% of total crypto market capitalization, entered 2025 with unstoppable momentum under a crypto‑friendly Trump administration. The rally was supported by major regulatory wins and accelerating institutional adoption.

Ten questions that matter going into 2026

2026 may be less about a neat “base case” and more about a regime shift—the market can reprice what matters most (growth, inflation, fiscal, geopolitics, concentration). The biggest trap is false comfort: the same trades can look defensive… right up until they become crowded.

XRP steadies above $1.90 support as fund inflows and retail demand rise

Ripple (XRP) is stable above support at $1.90 at the time of writing on Monday, after several attempts to break above the $2.00 hurdle failed to materialize last week. Meanwhile, institutional interest in the cross-border remittance token has remained steady.