GBP/USD Price Analysis: Ease in risk-off impulse and firmer UK retail demand support Cable


  • The pound Sterling has picked demand on ease in risk-off mood and firmer Like-For-Like Retail Sales data.
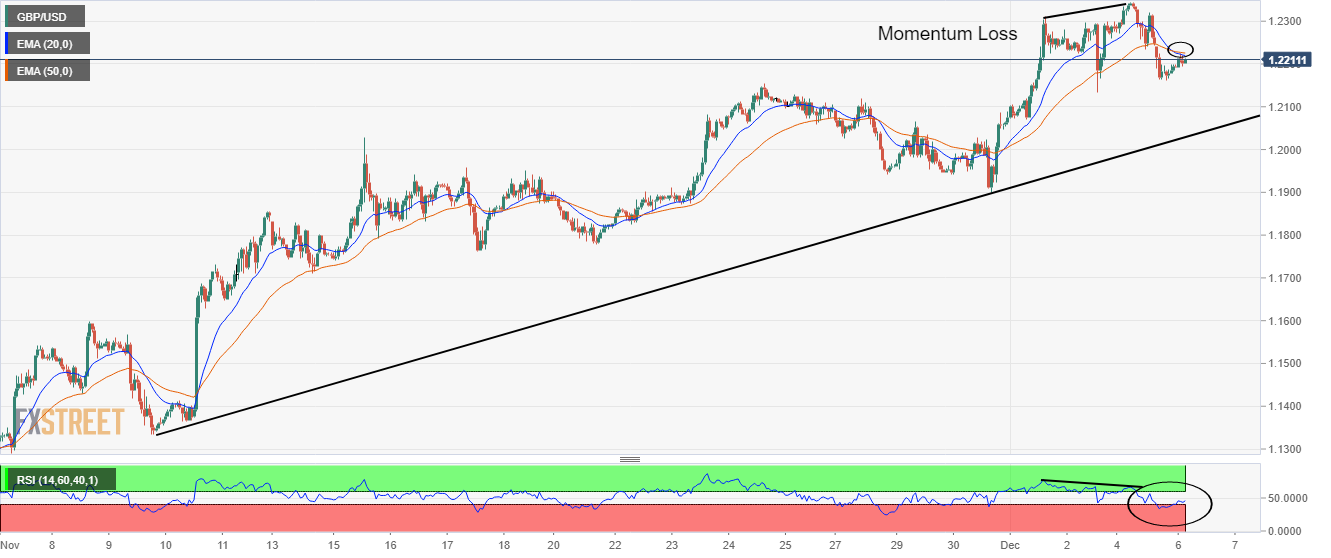
  • A loss in upside momentum resulted in a sell-off in Cable.
  • A bear cross, represented by the 20-and 50-period EMAs at 1.2230, adds to the downside filters.

The GBP/USD pair has extended its recovery above the psychological resistance of 1.2200 in the Tokyo session. The Cable picked reversal after dropping to near 1.2167 as the risk-off impulse has trimmed marginally. Apart from that, upbeat Like-For-Like Retail Sales by the British Retail Consortium (BRC) have supported Pound Sterling.

Meanwhile, the US Dollar Index (DXY) is putting efforts into sustaining above the round-level cushion of 105.00. The 10-year US Treasury yields have sensed selling pressure after printing a high of 3.59%.

On an hourly scale, Cable has witnessed selling pressure from market participants after failing to keep the upside momentum intact. The asset was making higher highs while the momentum oscillator, Relative Strength Index (RSI) (14), formed a lower high on Monday. A loss in the upside momentum forced investors to book longs.

A bear cross, represented by the 20-and 50-period Exponential Moving Averages (EMAs) at 1.2230, adds to the downside filters.

Meanwhile, the RSI (14) is hovering around 40.00. A slippage inside the bearish range of 20.00-40.00 will trigger a bearish momentum.

Going forward, a decline below Friday’s low at 1.2134 will drag the Cable toward the psychological resistance at 1.2000, followed by the 20-EMA around 1.1971.

On the flip side, a break above Monday’s high at 1.2345 will drive the Cable toward June 16 high of around 1.2400. A breach of the latter will send the major toward June 1 low at 1.2460.

GBP/USD hourly chart

GBP/USD

Overview
Today last price 1.22
Today Daily Change 0.0021
Today Daily Change % 0.17
Today daily open 1.2179
 
Trends
Daily SMA20 1.1919
Daily SMA50 1.1533
Daily SMA100 1.1658
Daily SMA200 1.2143
 
Levels
Previous Daily High 1.2345
Previous Daily Low 1.2162
Previous Weekly High 1.2311
Previous Weekly Low 1.19
Previous Monthly High 1.2154
Previous Monthly Low 1.1147
Daily Fibonacci 38.2% 1.2232
Daily Fibonacci 61.8% 1.2275
Daily Pivot Point S1 1.2112
Daily Pivot Point S2 1.2045
Daily Pivot Point S3 1.1929
Daily Pivot Point R1 1.2295
Daily Pivot Point R2 1.2412
Daily Pivot Point R3 1.2478


Share: Feed news

Information on these pages contains forward-looking statements that involve risks and uncertainties. Markets and instruments profiled on this page are for informational purposes only and should not in any way come across as a recommendation to buy or sell in these assets. You should do your own thorough research before making any investment decisions. FXStreet does not in any way guarantee that this information is free from mistakes, errors, or material misstatements. It also does not guarantee that this information is of a timely nature. Investing in Open Markets involves a great deal of risk, including the loss of all or a portion of your investment, as well as emotional distress. All risks, losses and costs associated with investing, including total loss of principal, are your responsibility. The views and opinions expressed in this article are those of the authors and do not necessarily reflect the official policy or position of FXStreet nor its advertisers. The author will not be held responsible for information that is found at the end of links posted on this page.

If not otherwise explicitly mentioned in the body of the article, at the time of writing, the author has no position in any stock mentioned in this article and no business relationship with any company mentioned. The author has not received compensation for writing this article, other than from FXStreet.

FXStreet and the author do not provide personalized recommendations. The author makes no representations as to the accuracy, completeness, or suitability of this information. FXStreet and the author will not be liable for any errors, omissions or any losses, injuries or damages arising from this information and its display or use. Errors and omissions excepted.

The author and FXStreet are not registered investment advisors and nothing in this article is intended to be investment advice.

Recommended content


Recommended content

Editors’ Picks

AUD/USD hovers around 0.6500 amid light trading, ahead of US GDP

AUD/USD hovers around 0.6500 amid light trading, ahead of US GDP

AUD/USD is trading close to 0.6500 in Asian trading on Thursday, lacking a clear directional impetus amid an Anzac Day holiday in Australia. Meanwhile, traders stay cautious due ti risk-aversion and ahead of the key US Q1 GDP release. 

AUD/USD News

USD/JPY finds its highest bids since 1990, near 155.50

USD/JPY finds its highest bids since 1990, near 155.50

USD/JPY keeps breaking into its highest chart territory since June of 1990 early Thursday, testing 155.50 for the first time in 34 years as the Japanese Yen remains vulnerable, despite looming Japanese intervention risks. Focus shifts to Thursday's US GDP report and the BoJ decision on Friday. 

USD/JPY News

Gold price treads water near $2,320, awaits US GDP data

Gold price treads water near $2,320, awaits US GDP data

Gold price recovers losses but keeps its range near $2,320 early Thursday. Renewed weakness in the US Dollar and the US Treasury yields allow Gold buyers to breathe a sigh of relief. Gold price stays vulnerable amid Middle East de-escalation, awaiting US Q1 GDP data. 

Gold News

Injective price weakness persists despite over 5.9 million INJ tokens burned

Injective price weakness persists despite over 5.9 million INJ tokens burned

Injective price is trading with a bearish bias, stuck in the lower section of the market range. The bearish outlook abounds despite the network's deflationary efforts to pump the price. Coupled with broader market gloom, INJ token’s doomed days may not be over yet.

Read more

Meta Platforms Earnings: META sinks 10% on lower Q2 revenue guidance Premium

Meta Platforms Earnings: META sinks 10% on lower Q2 revenue guidance

This must be "opposites" week. While Doppelganger Tesla rode horrible misses on Tuesday to a double-digit rally, Meta Platforms produced impressive beats above Wall Street consensus after the close on Wednesday, only to watch the share price collapse by nearly 10%.

Read more

Forex MAJORS

Cryptocurrencies

Signatures