|

GBP/USD Price Analysis: Cable looks set to regain 1.3000 as technical details favor bulls

  • GBP/USD reverses from one-week low, snaps four-day losing streak.
  • Bullish candlestick, U-turn from key support confluence and RSI’s rebound from oversold territory favor Cable bulls.
  • Pound Sterling weakness appears elusive beyond 200-EMA; five-week-old horizontal support will also prod sellers.

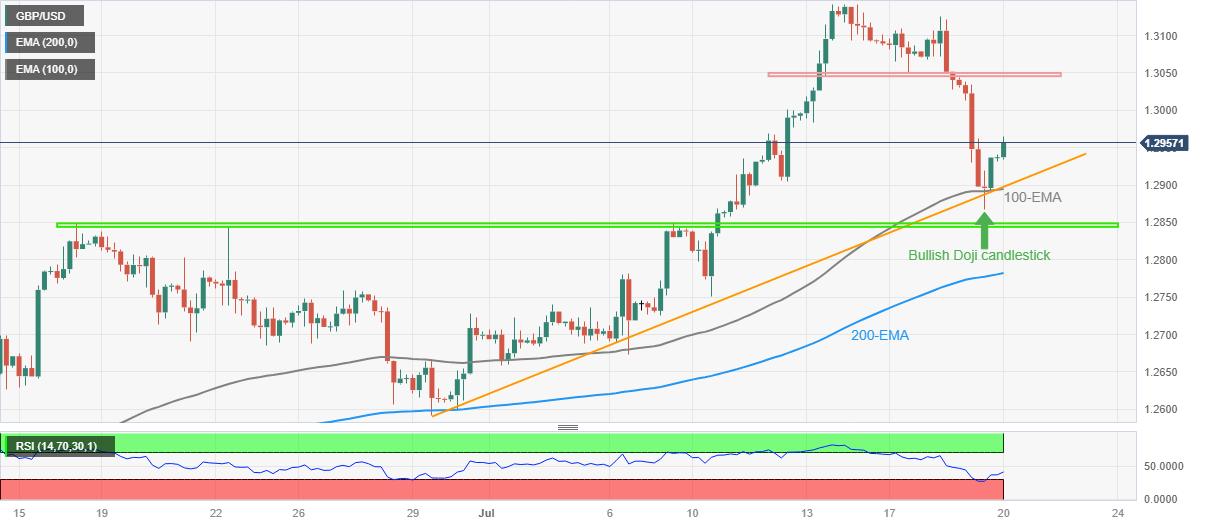
GBP/USD remains on the front foot around the intraday high of near 1.2965 amid early Thursday morning in London, snapping a four-day downtrend while reversing from the lowest levels in seven days. In doing so, the Cable pair justifies multiple technical signals which favor the bullish bias about the Pound Sterling price.

Among them, Wednesday’s bullish Doji candlestick at the weekly low gains major attention as it prevails at the convergence of the 100-bar Exponential Moving Average (EMA) and a three-week-long rising support line. Adding strength to the upside bias is the RSI (14) line’s rebound from the oversold region.

With this, the GBP/USD price appears well-set to regain the 1.3000 round figure. However, a horizontal area comprising lows marked during the mid-July, around 1.3045-50 may prod the pair buyers afterward.

In a case where the Cable pair remains firmer past 1.3050, the odds of witnessing a run-up toward the monthly high of 1.3142 can’t be ruled out.

On the contrary, a successful downside break of the 1.2895-90 support confluence, comprising the multi-day-old rising support line and the 100-EMA, can please the intraday sellers but may not term the GBP/USD pair as bearish as a five-week-old horizontal area near 1.2850 can prod the sellers.

Apart from the 1.2850 support, the 200-EMA level of around 1.2780 also acts as the final defense of the GBP/USD bulls.

GBP/USD: Four-hour chart

Trend: Further upside expected

Additional important levels

Overview
Today last price1.296
Today Daily Change0.0020
Today Daily Change %0.15%
Today daily open1.294
 
Trends
Daily SMA201.2831
Daily SMA501.2643
Daily SMA1001.249
Daily SMA2001.223
 
Levels
Previous Daily High1.3045
Previous Daily Low1.2868
Previous Weekly High1.3142
Previous Weekly Low1.275
Previous Monthly High1.2848
Previous Monthly Low1.2369
Daily Fibonacci 38.2%1.2935
Daily Fibonacci 61.8%1.2977
Daily Pivot Point S11.2857
Daily Pivot Point S21.2774
Daily Pivot Point S31.268
Daily Pivot Point R11.3034
Daily Pivot Point R21.3127
Daily Pivot Point R31.321

Author

Anil Panchal

Anil Panchal

FXStreet

Anil Panchal has nearly 15 years of experience in tracking financial markets. With a keen interest in macroeconomics, Anil aptly tracks global news/updates and stays well-informed about the global financial moves and their implications.

More from Anil Panchal
Share:

Markets move fast. We move first.

Orange Juice Newsletter brings you expert driven insights - not headlines. Every day on your inbox.

By subscribing you agree to our Terms and conditions.

Editor's Picks

EUR/USD bounces toward 1.1750 as US Dollar loses strength

EUR/USD returned to the 1.1750 price zone in the American session on Friday, despite falling Wall Street, which indicates risk aversion. Trading conditions remain thin following the New Year holiday and ahead of the weekend, with the focus shifting to US employment and European data scheduled for next week.

GBP/USD nears 1.3500, holds within familiar levels

After testing 1.3400 on the last day of 2025, GBP/USD managed to stage a rebound. Nevertheless, the pair finds it difficult to gather momentum and trades with modest intraday gains at around 1.3490 as market participants remain in holiday mood.

Gold trims intraday gains, approaches $4,300

Gold retreated sharply from the $4,400  area and trades flat for the day in the $4,320 price zone. Choppy trading conditions exacerbated the intraday decline, although XAU/USD bearish case is out of the picture, considering growing expectations for a dovish Fed and persistent geopolitical tensions.

Cardano gains early New Year momentum, bulls target falling wedge breakout

Cardano kicks off the New Year on a positive note and is extending gains, trading above $0.36 at the time of writing on Friday. Improving on-chain and derivatives data point to growing bullish interest, while the technical outlook keeps an upside breakout in focus.

Economic outlook 2026-2027 in advanced countries: Solidity test

After a year marked by global economic resilience and ending on a note of optimism, 2026 looks promising and could be a year of solid economic performance. In our baseline scenario, we expect most of the supportive factors at work in 2025 to continue to play a role in 2026.

Crypto market outlook for 2026

Year 2025 was volatile, as crypto often is.  Among positive catalysts were favourable regulatory changes in the U.S., rise of Digital Asset Treasuries (DAT), adoption of AI and tokenization of Real-World-Assets (RWA).