|

GBP/USD Price Analysis: Cable bears need validation from 1.2530 and US ISM Services PMI

  • GBP/USD licks its wounds after refreshing three-month low.
  • 10-week-old descending support line, sluggish MACD signals and the below-50 RSI favor corrective bounce.
  • Convergence of 100-EMA, 38.2% Fibonacci ratio guards immediate recovery of Cable pair.
  • Pound Sterling traders seek directions from US ISM Services PMI amid light calendar at home.

GBP/USD portrays a corrective bounce off the short-term key support line while picking up bids to 1.2570 during the early hours of Wednesday’s trading.

The Cable pair dropped to the lowest level since June 13 amid broad US Dollar strength before a 2.5-month-long falling trend line joined downbeat oscillators to trigger the quote’s bounce. However, the cautious mood ahead of the US ISM Services PMI for August, expected 52.6 versus 52.7 prior, as well as the final readings of the US S&P Global PMIs for the said month, prod the Pound Sterling traders of late.

Also read: ISM Services PMI Preview: Strength may spook markets, boosting US Dollar

Given the GBP/USD pair’s rebound from the aforementioned key support line, backed by sluggish MACD signals and the below-50.0 RSI (14) conditions, the quote is likely to edge higher.

However, a convergence of the 100-day Exponential Moving Average (EMA) and the 38.2% Fibonacci retracement of its March–July upside, near 1.2630, will be a crucial upside hurdle to convince the Cable buyers to return to the table.

Following that, a downward-sloping resistance line from late July, around the 1.2700 round figure, will act as the final defense of the GBP/USD bears.

On the contrary, a downward-sloping support line from late June, around 1.2530 by the press time, puts a floor under the GBP/USD price ahead of the 200-EMA support of 1.2490.

In a case where the Pound Sterling remains bearish past 1.2490, the odds of witnessing a slump to the 61.8% Fibonacci retracement level, also known as the Golden Ratio, surrounding 1.2315 can’t be ruled out.

GBP/USD: Daily chart

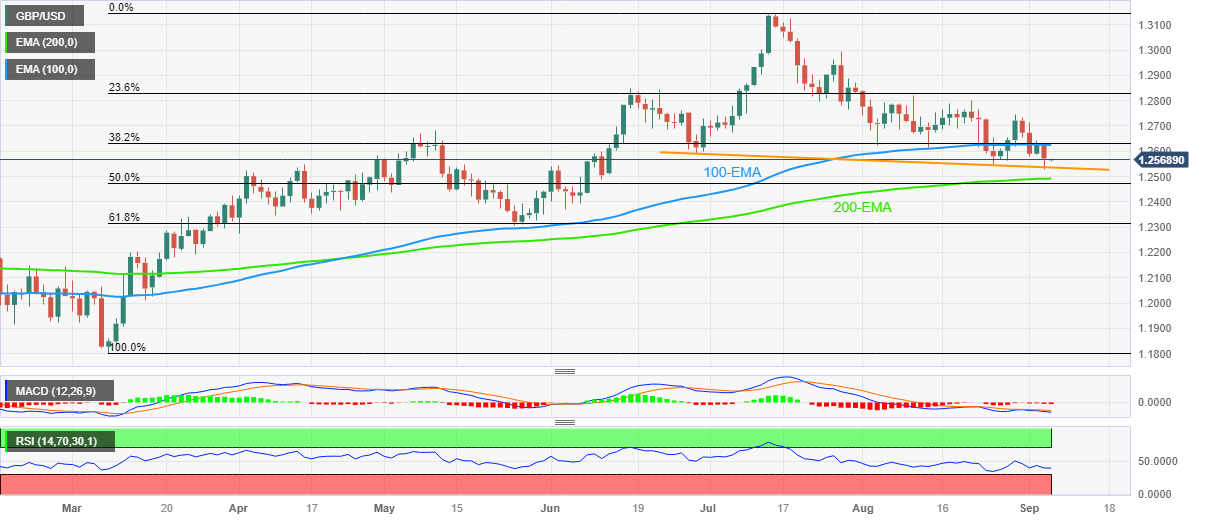
Trend: Corrective bounce expected

Additional important levels

Overview
Today last price1.2569
Today Daily Change-0.0057
Today Daily Change %-0.45%
Today daily open1.2626
 
Trends
Daily SMA201.2685
Daily SMA501.2775
Daily SMA1001.2652
Daily SMA2001.2419
 
Levels
Previous Daily High1.2643
Previous Daily Low1.2587
Previous Weekly High1.2746
Previous Weekly Low1.2563
Previous Monthly High1.2841
Previous Monthly Low1.2548
Daily Fibonacci 38.2%1.2621
Daily Fibonacci 61.8%1.2608
Daily Pivot Point S11.2595
Daily Pivot Point S21.2563
Daily Pivot Point S31.2539
Daily Pivot Point R11.265
Daily Pivot Point R21.2674
Daily Pivot Point R31.2706

Author

Anil Panchal

Anil Panchal

FXStreet

Anil Panchal has nearly 15 years of experience in tracking financial markets. With a keen interest in macroeconomics, Anil aptly tracks global news/updates and stays well-informed about the global financial moves and their implications.

More from Anil Panchal
Share:

Markets move fast. We move first.

Orange Juice Newsletter brings you expert driven insights - not headlines. Every day on your inbox.

By subscribing you agree to our Terms and conditions.

Editor's Picks

EUR/USD runs past 1.1730 after tepid US macroeconomic figures

EUR/USD extends its gains and trades above 1.1730 in the American session on Thursday. The US Dollar resumed its decline, following much weaker-than-expected Initial Jobless Claims. Market players bet for additional rate cuts despite a mildly hawkish Fed.

GBP/USD ticks north beyond 1.3400 after US employment data

GBP/USD ticks beyond 1.3400 in the American session on Thursday, as the US Dollar is back on the losing side, following worse-than-anticipated US employment-related figures. The US Federal Reserve delivered a rate cut at its December meeting, in line with the market’s expectations.

Gold bounces off $4,200 neighborhood, down a little amid mixed fundamental cues

Gold recovers slightly from the vicinity of the $4,200 mark, though it sticks to its negative bias through the first half of the European session. The US Dollar attracts some buyers and recovers a part of the previous day's post-FOMC slump to its lowest level since October 24. This fails to assist the commodity in capitalizing on its modest intraday uptick to the weekly high.

Solana dips as hawkish Fed cuts dampen market sentiment

Solana price is trading below $130 on Thursday, after being rejected at the upper boundary of its falling wedge pattern. The broader market weakness following the Federal Reserve’s hawkish rate cut has added to downside momentum.

FOMC Summary: A split cut and a clear shift toward caution

The Federal Reserve (Fed) went ahead with a 25 basis points rate cut, taking the target range to 3.50–3.75%. But the tone around the decision mattered just as much as the move.

Solana dips as hawkish Fed cuts dampen market sentiment
Solana (SOL) price is trading below $130 at the time of writing on Thursday, after being rejected at the upper boundary of its falling wedge pattern. The broader market weakness following the Federal Reserve’s hawkish rate cut has added to downside momentum.