|

GBP/USD Price Analysis: Cable bears eye 1.2600 region, focus on UK GDP, Fed’s favorite inflation

  • GBP/USD seesaws around the lowest levels in two weeks, prods two-day downtrend of late.
  • Bearish MACD signals, clear downside break of two-month-old horizontal support keep Pound Sterling bears hopeful.
  • Multiple rising support lines, 100-EMA joins steady RSI to test Cable bears.
  • Upbeat UK GDP, softer US inflation clues may allow Pound Sterling buyers to reprint 1.2600 on chart.

GBP/USD treads water at the lowest levels in two weeks, around 1.2610-1.2600 amid early Friday morning in Asia. In doing so, the Cable pair fails to justify the midweek’s downside break of the key horizontal support, now resistance, as well as the bearish MACD signals.

The Pound Sterling’s latest inaction could be linked to the market’s cautious mood ahead of the top-tier US and UK data, as well as the presence of ascending support lines from March and May, as well as the steady RSI (14) line.

Hence, the GBP/USD pair is likely to grind lower and suggests a battle with the ascending support line from March 08, around 1.2565, to be imminent.

The Pound Sterling’s weakness past 1.2565, however, isn’t an open invitation to the GBP/USD bears as a five-week-old rising support line, close to 1.2525, will precede the 100-day Exponential Moving Average (EMA), around 1.2420, to restrict further downside of the pair.

Meanwhile, the GBP/USD pair’s corrective bounce past the horizontal area comprising multiple levels marked since early May, between 1.2670 and 1.2690, appears a tough nut to crack for the Cable pair buyers during the corrective bounce.

In a case where the GBP/USD manages to remain firmer past 1.2690, the odds of witnessing a rally towards the yearly top marked in mid-June around 1.2850 can’t be ruled out.

GBP/USD: Daily chart

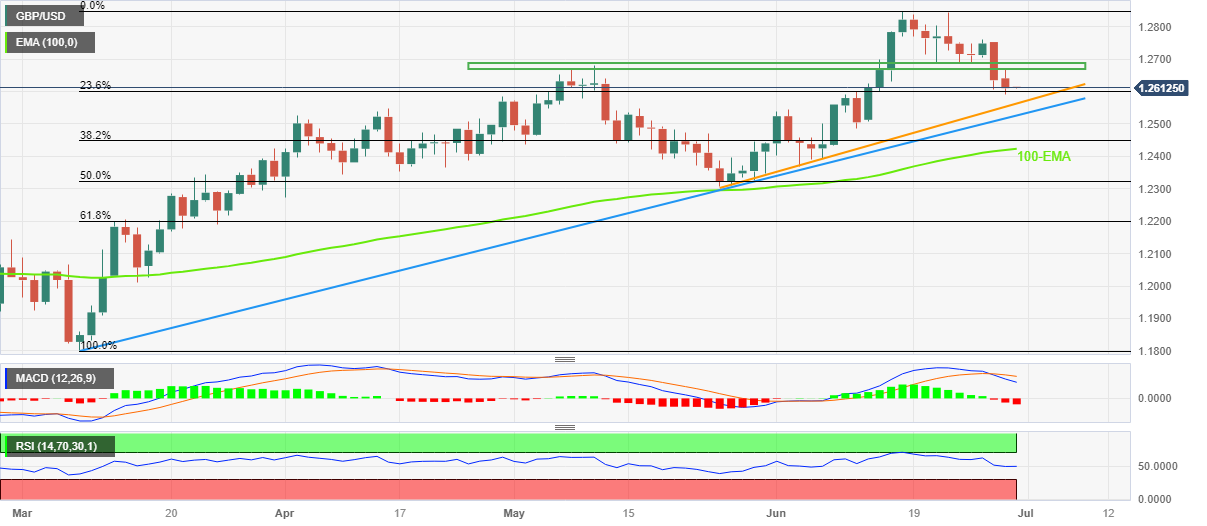
Trend: Further downside expected

Additional important levels

Overview
Today last price1.2612
Today Daily Change-0.0023
Today Daily Change %-0.18%
Today daily open1.2635
 
Trends
Daily SMA201.2635
Daily SMA501.254
Daily SMA1001.2368
Daily SMA2001.2096
 
Levels
Previous Daily High1.2753
Previous Daily Low1.2606
Previous Weekly High1.2845
Previous Weekly Low1.2685
Previous Monthly High1.268
Previous Monthly Low1.2308
Daily Fibonacci 38.2%1.2662
Daily Fibonacci 61.8%1.2697
Daily Pivot Point S11.2577
Daily Pivot Point S21.2519
Daily Pivot Point S31.2431
Daily Pivot Point R11.2723
Daily Pivot Point R21.2811
Daily Pivot Point R31.2869

Author

Anil Panchal

Anil Panchal

FXStreet

Anil Panchal has nearly 15 years of experience in tracking financial markets. With a keen interest in macroeconomics, Anil aptly tracks global news/updates and stays well-informed about the global financial moves and their implications.

More from Anil Panchal
Share:

Editor's Picks

GBP/USD appears well offered near 1.3160

GBP/USD builds on Tuesday’s losses, although it now manages to pick up some pace and bounce off earlier multi-month troughs near 1.3140. The Greenback’s solid performance and continued political turmoil in the UK are keeping Cable under persistent pressure, with little sign of a meaningful recovery.

EUR/USD rebounds from lows, back to 1.1360

After bottoming out near 1.1320, EUR/USD gathers some traction and reclaims the 1.1350-1.1360 band as the NA session draws to a close on Wednesday. The pair’s drop to multi-month lows comes in response to the continuous leg higher in the US Dollar, which remains propped up by hawkish Fed expectations and uncertainty over the outcome of US-Iran peace negotiations.

Gold pressured near fresh 2026 lows

Gold accelerates its decline and gyrates around the key $4,000 mark per troy ounce on Wednesday, its lowest level since November 2025. In the meantime, tighter-for-longer Fed expectations and a broadly firmer US Dollar continue to weigh on the yellow metal, while uncertainty surrounding a potential US-Iran peace agreement has done little to revive demand for the safe haven space.

XRP nears key support as Fed hike risks suppress demand
Ripple (XRP) continues to face significant selling pressure, trading around $1.05 at the time of writing on Wednesday. This decline mirrors the broader weakness in the crypto market, exacerbated by mounting macroeconomic headwinds and persistent geopolitical uncertainties.
US-Iran talks: The next 60 days will decide where Oil prices go next
Oil markets received some encouraging news after weeks of rising tensions in the Middle East. But let’s not get ahead of ourselves: we’re far from victory, and markets just seem to have priced out the worst-case scenario. The US and Iran have reportedly made "substantive progress" in talks in Switzerland and agreed on a framework for working toward a broader deal within 60 days.
Regime change: Inside Kevin Warsh's first move to make the Fed unreadable on purpose

The rate did not move. That was the least interesting thing about Kevin Warsh's first meeting in charge of the Fed. The FOMC held its benchmark at 3.50%-3.75% for the fourth straight meeting, exactly as priced, and then the new chair used his first press conference to dismantle the machinery the market has leaned on for a decade.