|

GBP/USD Price Analysis: Bulls step back from multi-day-old hurdle near 1.2210

  • GBP/USD retreats from five-week high, stays mildly bid during three-day uptrend.
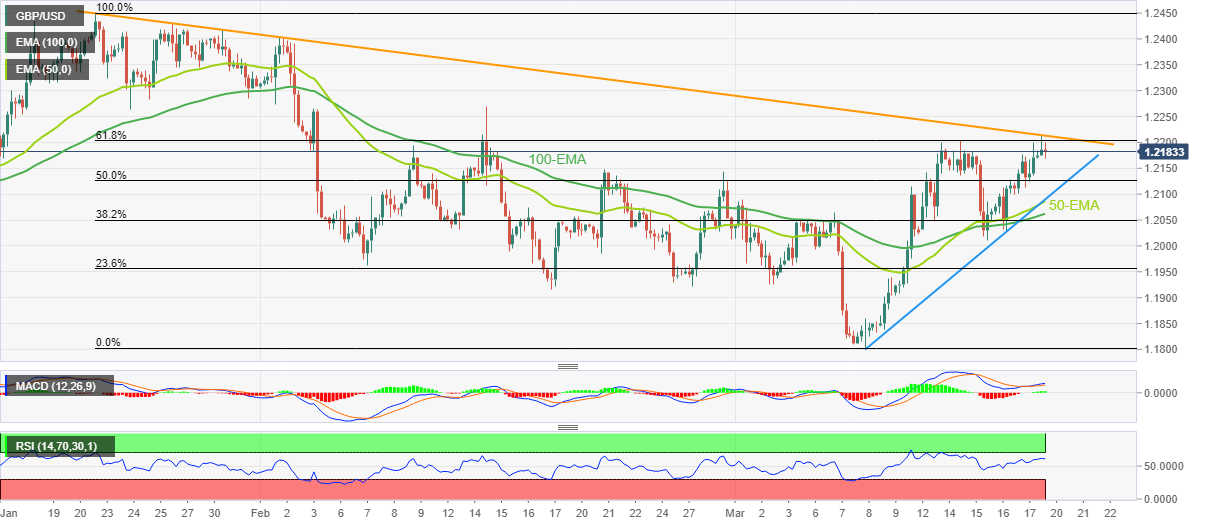
  • 61.8% Fibonacci retracement, two-month-old resistance line challenge Cable buyers.
  • Oscillators suggest receding strength in upside momentum but bears need validation from 100-EMA to retake control.

GBP/USD bulls take a breather around a five-week high, recently declining to 1.2185 as it reverses from the key resistance line during early Monday. Even so, the Cable pair remains mildly bid while printing a three-day winning streak.

That said, a downward-sloping resistance line from late January, around 1.2210 by the press time, appears a tough nut to crack for the GBP/USD pair buyers amid nearly overbought RSI (14) and mildly bullish MACD signals.

Also acting as an upside hurdle is the 61.8% Fibonacci retracement level of the quote’s fall from late January to early March, around the 1.2200 round figure.

It should be noted that the mid-February top surrounding 1.2270 appears the last defense of the GBP/USD bears, a break of which could propel the Cable price towards the 2023 top marked in January around 1.2450.

On the flip side, the 50% Fibonacci retracement level of 1.2125 could lure intraday sellers of the GBP/USD pair but a convergence of the 50-EMA and one-week-old ascending support line, near 1.2085, appears a tough nut to crack for the bears to retake control.

Also acting as an important support is the 100-EMA level surrounding 1.2060, a break of which won’t hesitate to challenge multiple lows marked during late February, around 1.1930-20.

Overall, GBP/USD is likely to witness a pullback but the bears are far from retaking control.

GBP/USD: Four-hour chart

Trend: Pullback expected

Additional important levels

Overview
Today last price1.2187
Today Daily Change0.0012
Today Daily Change %0.10%
Today daily open1.2175
 
Trends
Daily SMA201.2029
Daily SMA501.2141
Daily SMA1001.2049
Daily SMA2001.1892
 
Levels
Previous Daily High1.2201
Previous Daily Low1.21
Previous Weekly High1.2204
Previous Weekly Low1.201
Previous Monthly High1.2402
Previous Monthly Low1.1915
Daily Fibonacci 38.2%1.2162
Daily Fibonacci 61.8%1.2138
Daily Pivot Point S11.2116
Daily Pivot Point S21.2058
Daily Pivot Point S31.2015
Daily Pivot Point R11.2217
Daily Pivot Point R21.2259
Daily Pivot Point R31.2318

Author

Anil Panchal

Anil Panchal

FXStreet

Anil Panchal has nearly 15 years of experience in tracking financial markets. With a keen interest in macroeconomics, Anil aptly tracks global news/updates and stays well-informed about the global financial moves and their implications.

More from Anil Panchal
Share:

Markets move fast. We move first.

Orange Juice Newsletter brings you expert driven insights - not headlines. Every day on your inbox.

By subscribing you agree to our Terms and conditions.

Editor's Picks

EUR/USD bounces toward 1.1750 as US Dollar loses strength

EUR/USD returned to the 1.1750 price zone in the American session on Friday, despite falling Wall Street, which indicates risk aversion. Trading conditions remain thin following the New Year holiday and ahead of the weekend, with the focus shifting to US employment and European data scheduled for next week.

GBP/USD nears 1.3500, holds within familiar levels

After testing 1.3400 on the last day of 2025, GBP/USD managed to stage a rebound. Nevertheless, the pair finds it difficult to gather momentum and trades with modest intraday gains at around 1.3490 as market participants remain in holiday mood.

Gold trims intraday gains, approaches $4,300

Gold retreated sharply from the $4,400  area and trades flat for the day in the $4,320 price zone. Choppy trading conditions exacerbated the intraday decline, although XAU/USD bearish case is out of the picture, considering growing expectations for a dovish Fed and persistent geopolitical tensions.

Cardano gains early New Year momentum, bulls target falling wedge breakout

Cardano kicks off the New Year on a positive note and is extending gains, trading above $0.36 at the time of writing on Friday. Improving on-chain and derivatives data point to growing bullish interest, while the technical outlook keeps an upside breakout in focus.

Economic outlook 2026-2027 in advanced countries: Solidity test

After a year marked by global economic resilience and ending on a note of optimism, 2026 looks promising and could be a year of solid economic performance. In our baseline scenario, we expect most of the supportive factors at work in 2025 to continue to play a role in 2026.

Crypto market outlook for 2026

Year 2025 was volatile, as crypto often is.  Among positive catalysts were favourable regulatory changes in the U.S., rise of Digital Asset Treasuries (DAT), adoption of AI and tokenization of Real-World-Assets (RWA).