GBP/USD Price Analysis: Bulls flirt with 1.2000 mark, focus remains on US NFP report
- GBP/USD scales higher for the third successive day and draws support from a combination of factors.
- The upbeat UK monthly GDP print boosts the GBP and acts as a tailwind amid a modest USD weakness.
- The mixed technical setup warrants some caution for bullish traders ahead of the key US NFP report.

The GBP/USD pair builds on this week's bounce from the 1.1800 mark, or its lowest level since November 2022, and gains some follow-through traction for the third successive day on Friday. The momentum lifts spot prices to a three-day high during the first half of the European session, with bulls now awaiting a sustained strength beyond the 1.2000 psychological mark before placing fresh bets.
The British Pound gets a boost on the last day of the week after the monthly UK GDP report showed the economy expanded by 0.3% in January. The reading exceeded market expectations for a growth of 0.1% and marks a sharp rebound from the 0.5% contraction recorded in December. The US Dollar, on the other hand, remains on the defensive amid reduced bets for a jumbo 50 bps lift-off at the March FOMC meeting, which, in turn, lends additional support to the GBP/USD pair.
That said, the prevalent risk-off environment - as depicted by a sea of red across the global equity markets amid looming recession risk - helps limit deeper losses for the safe-haven Greenback. Traders also seem reluctant to place aggressive bets and prefer to wait on the sidelines ahead of the US NFP report, due for release later during the early North American session. This, in turn, might keep a lid on any further appreciating move for the GBP/USD pair, at least for the time being.
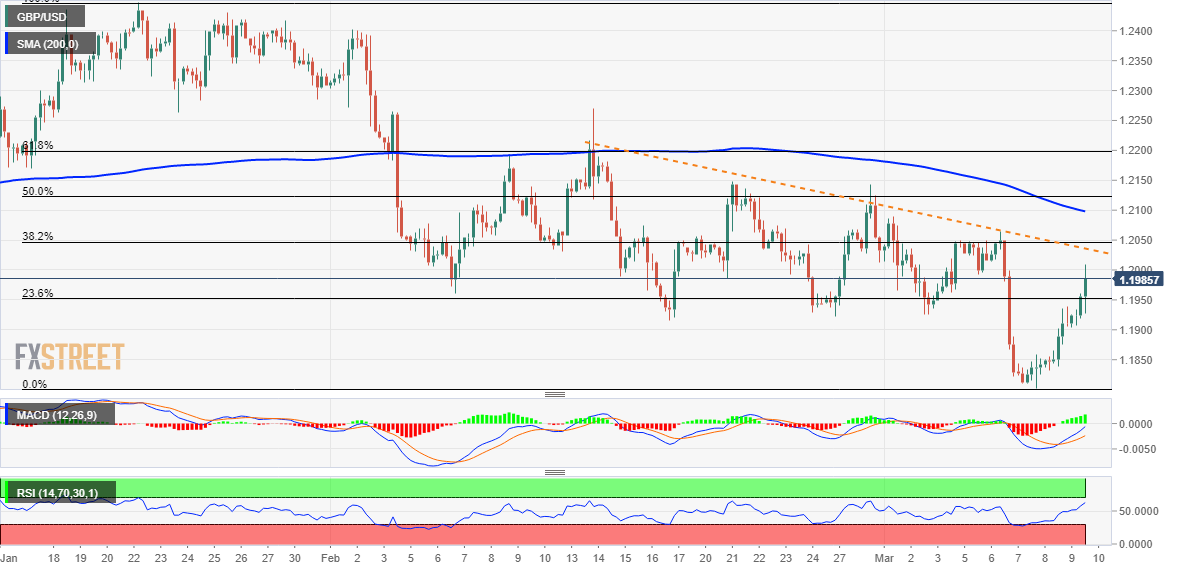
From a technical perspective, the intraday positive move lifts spot prices beyond the 23.6% Fibonacci retracement level of the recent corrective decline from the vicinity of the mid-1.2450 area, or a multi-month high touched in January. Furthermore, oscillators on the 4-hourly charts have been gaining strong positive traction. This, in turn, supports prospects for an extension of the upward trajectory towards testing the 38.2% Fibo. level, which coincides with the 1.2050-1.2060 supply zone.
That said, technical indicators on the daily chart - though have been recovering - are yet to confirm a bullish outlook. Moreover, the Relative Strength Index (RSI) on the 1-hour chart is flashing overbought conditions and warrants some caution for bulls heading into the key data risks.
On the flip side, the 23.6% Fibo. level, around the mid-1.1900s, now seems to protect the immediate downside. The next relevant support is pegged near a technically significant 200-day Simple Moving Average (SMA), currently pegged around the 1.1900 round-figure mark. A convincing break below the latter will shift the near-term bias back in favour of bearish traders and make the GBP/USD pair vulnerable to accelerate the fall back towards challenging the 1.1800 mark.
GBP/USD 4-hour chart
Key levels to watch
Author

Haresh Menghani
FXStreet
Haresh Menghani is a detail-oriented professional with 10+ years of extensive experience in analysing the global financial markets.


