GBP/USD Price Analysis: Bulls eye a 38.2% Fibo in the 1.2120s
- GBP/USD is making tracks higher and bulls eye the 38.2% Fibonacci target of around the 1.2120s.
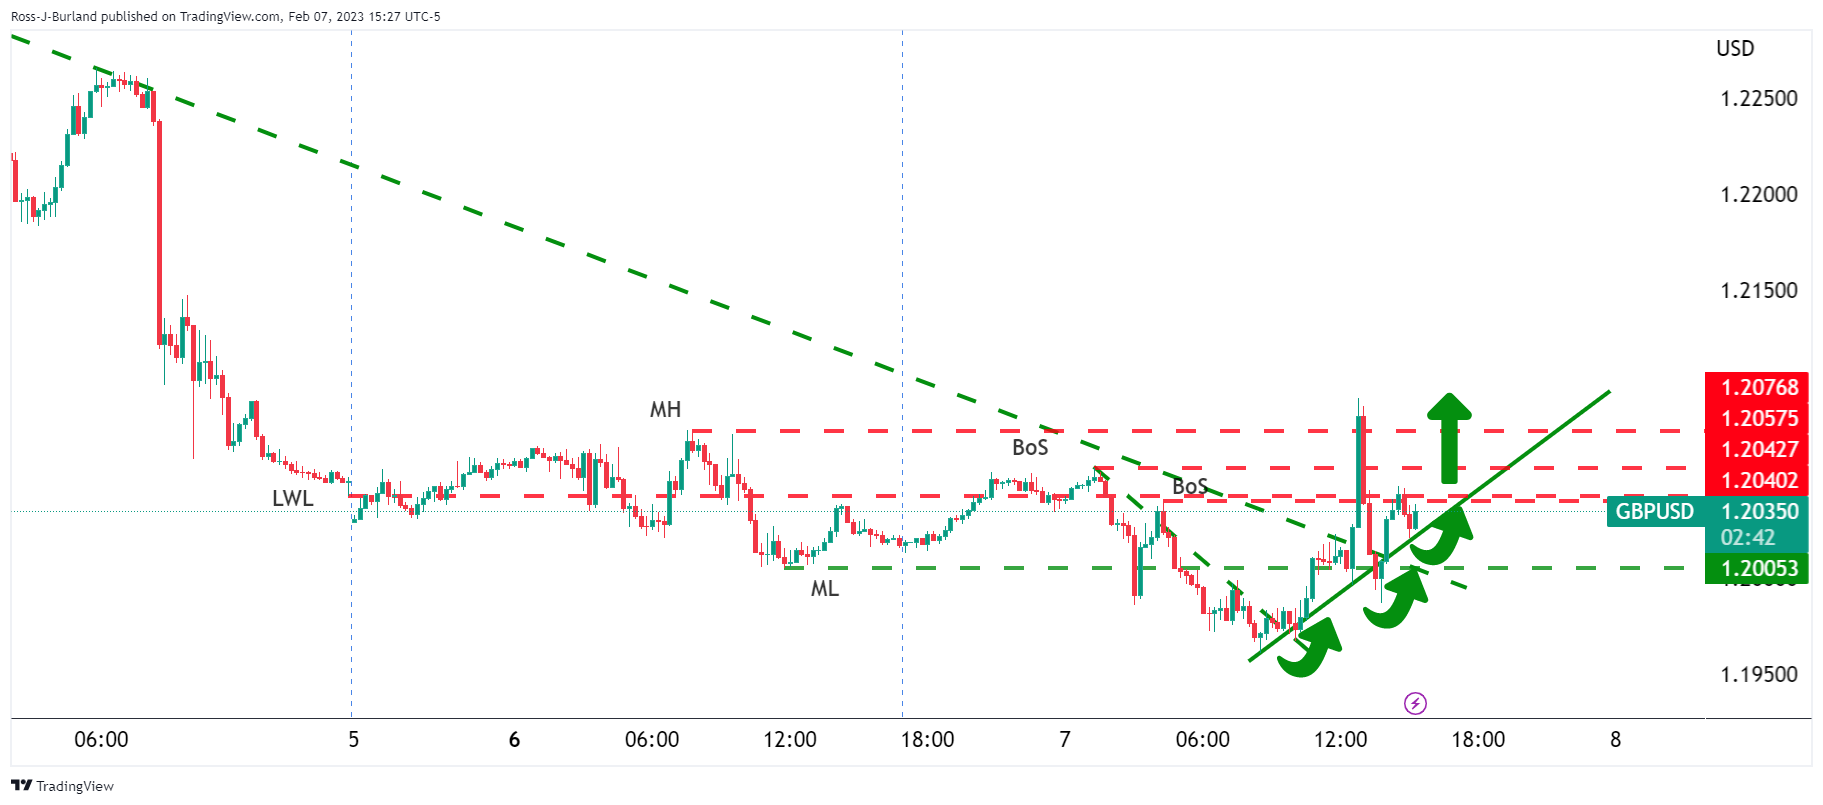
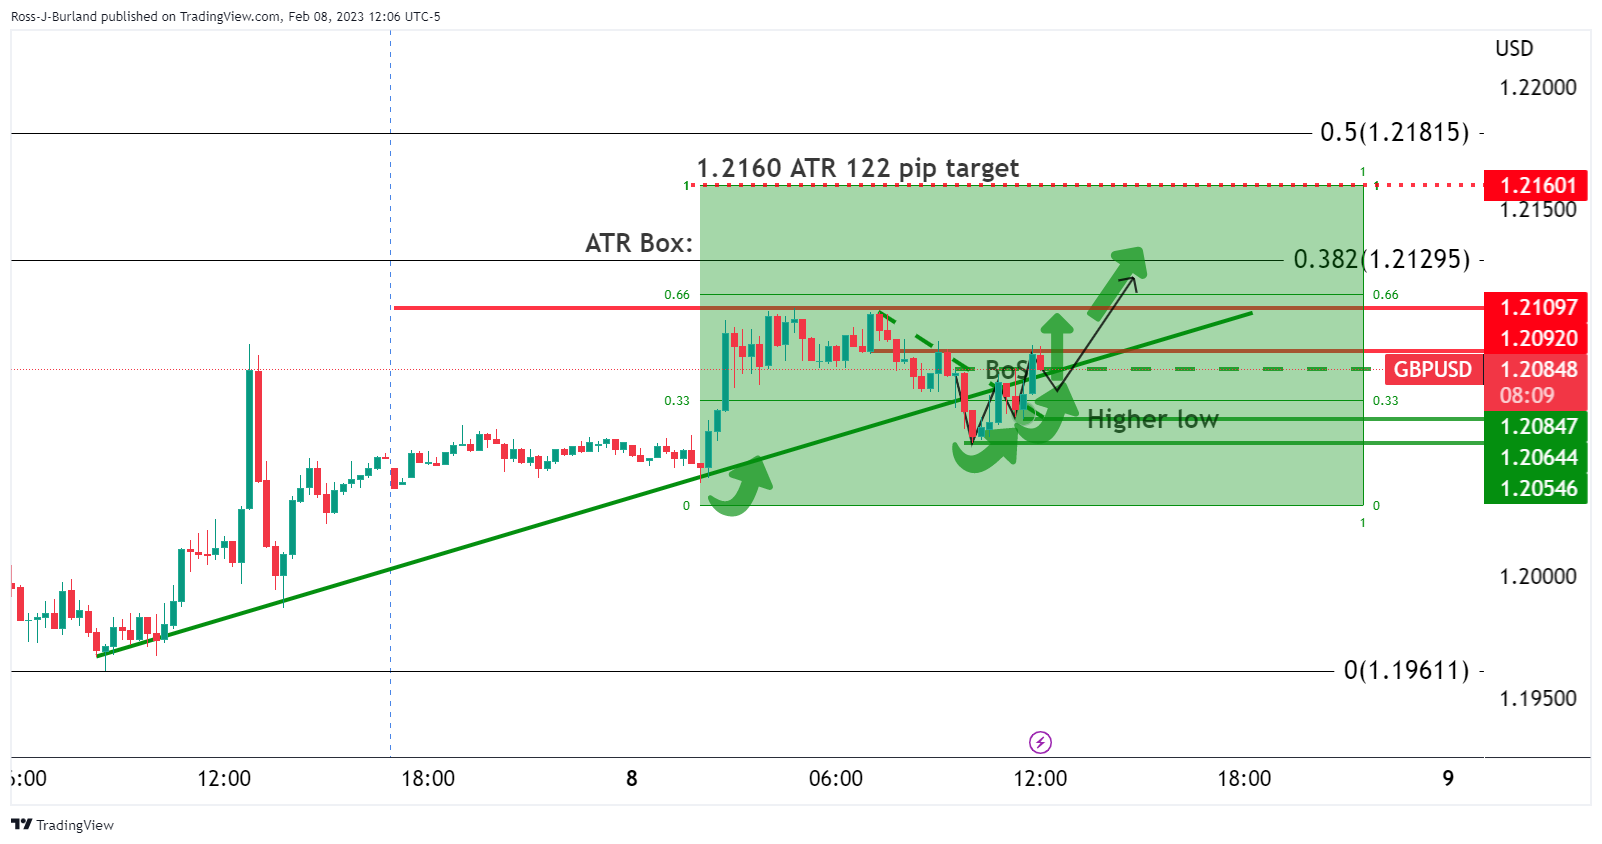
- On the 15-minute chart, GBP/USD is breaking the structure after putting in a higher low for the New York session.
- A break of 1.2092 is now what the bulls need to solidify the prospects of a push higher for the end of the day.

As per the prior analysis, GBP/USD Price Analysis: Bulls moving in on the bear's break of 1.2090 structure, the price rallied in a continuation of the bullish correction into the Daily bearish impulse as outlined in the article. We are now in the throws of a bullish reversal of the New York session with targets for a second bullish close for the middle of the week's trade as the following will illustrate.
GBP/USD prior analysis
GBP/USD bulls moved in on Tuesday and were setting the foundations for a bullish correction of the slide from the 1.23s at the start of February. The following illustrated the bullish bias for Wednesday (today):
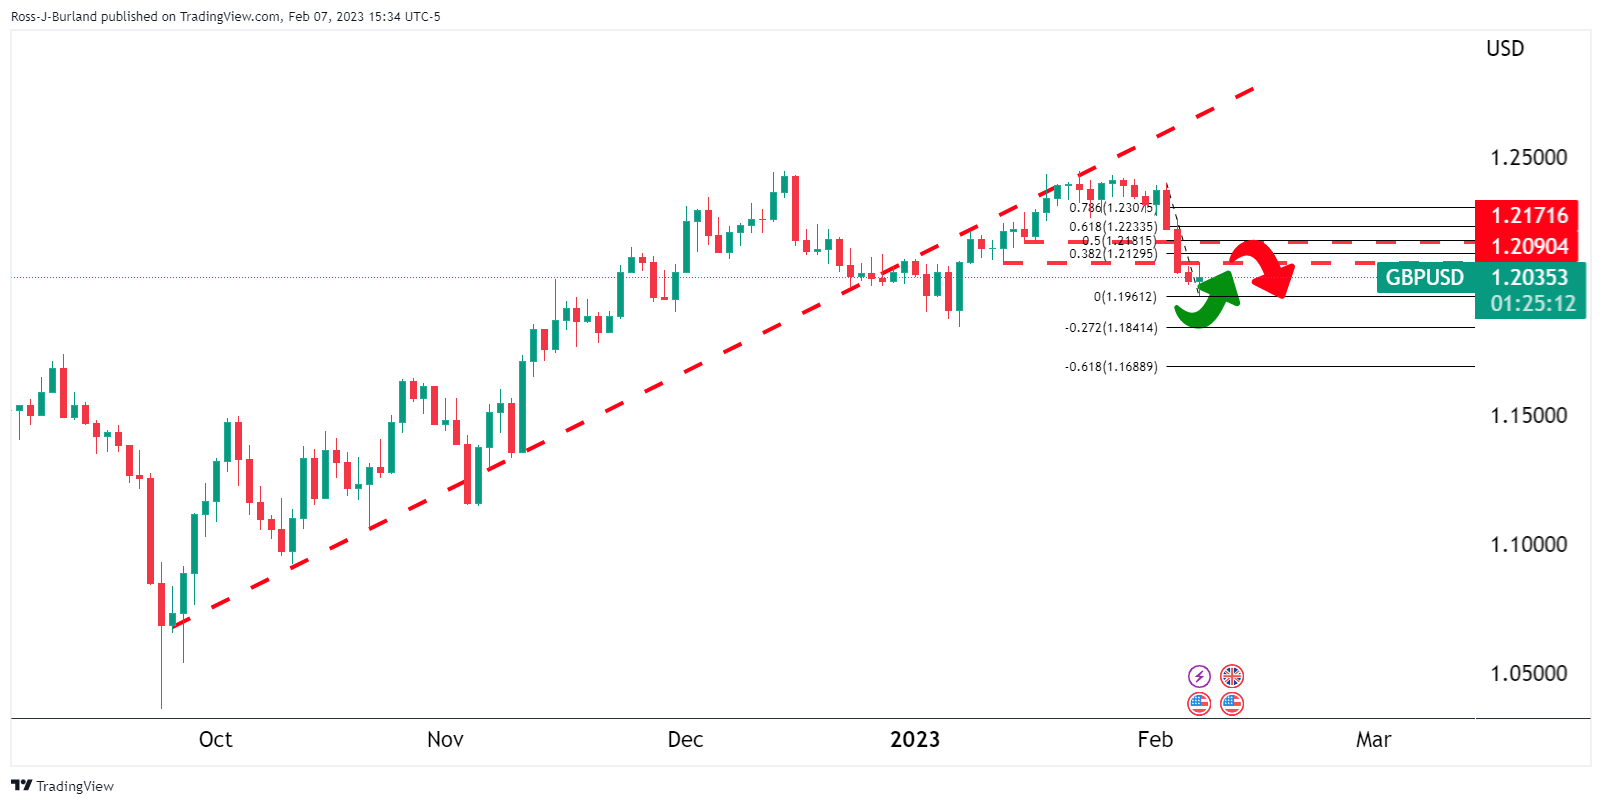
The price had rallied from a low of 1.1960 to a high of 1.2095, taking out Monday's high, MH, and breaking structures, BoS, along the way, The price had also moved to the backside of the prior bearish dynamic resistance, (bearish trendline), that was expected to act as a counter-trendline.
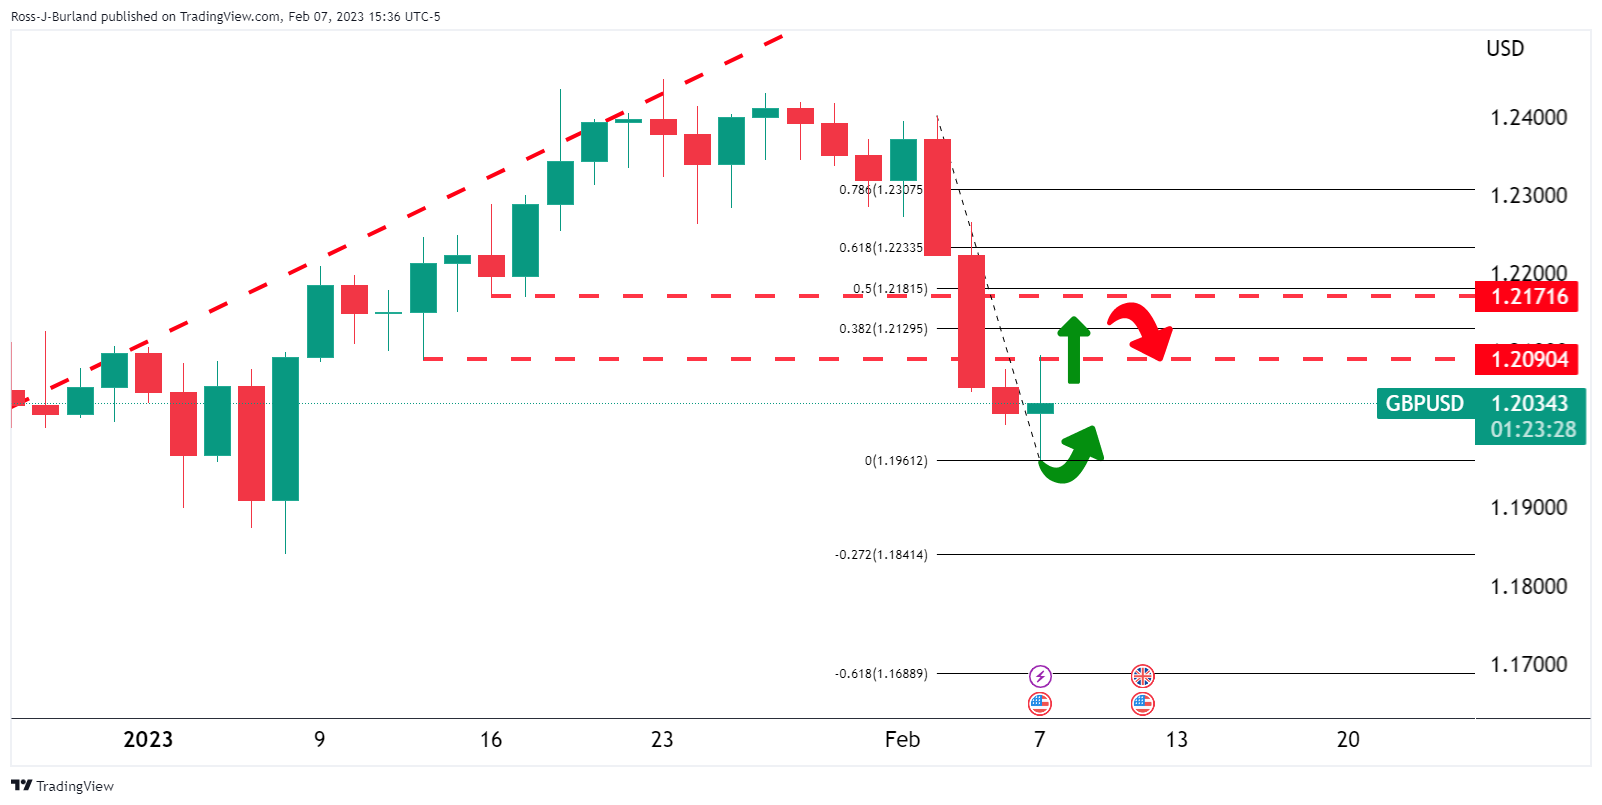
The breakout of those structures left the directional bias in favour of a meanwhile bullish correction on the daily chart for Wednesday, pending a bullish close on Tuesday (yesterday):
Zoomed in...
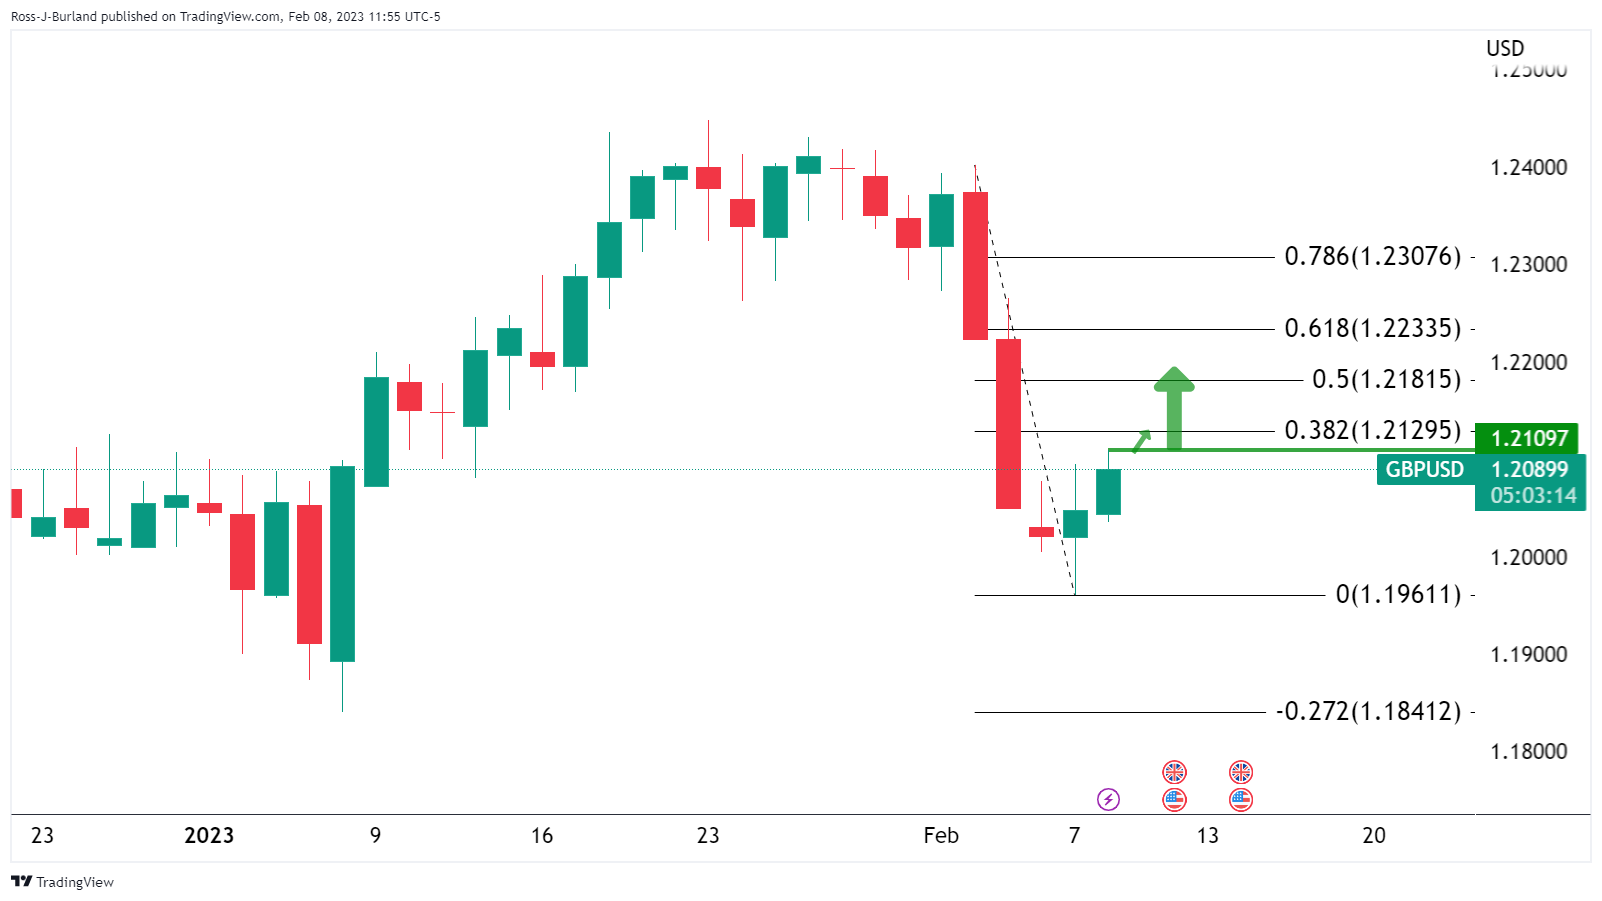
This left the foundations of a long trade for whichever session traders were. Asia was a sideways session, setting the foundations for an explosive move to the upside in the London day whereby GBP/USD rallied from a low of 1.2037 to a high of 1.2109.
GBP/USD, what now?
The question is whether there is anything left in the tank from the bulls in the US session. For the day to close bullish, which was yesterday's thesis, the price must close higher than Tuesday's closing price of 1.2046. The daily ATR is 122 pips and for the day so far the range has been between 1.2030 and 1.2109, 79 pips. This leaves further to go on the upside if the minimum of the daily ATR is to be reached coming in at around 1.2250.
On Tuesday, looking for a bullish setup, the 1.2180s were eyed in a 50% mean reversion target. On the way there, a 38.2% Fibonacci retracement was located at 1.2129 which is still vulnerable for today and certainly for the remainder of the week:
On the 15-minute chart, the price is breaking the structure after putting in a higher low for the New York session. A break of 1.2092 is now what the bulls need to solidify the prospects of a push higher for the end of the day towards the 38.2% Fibonacci target of around the 1.2120s:
Author

Ross J Burland
FXStreet
Ross J Burland, born in England, UK, is a sportsman at heart. He played Rugby and Judo for his county, Kent and the South East of England Rugby team.


