GBP/USD Price Analysis: Bulls are coming up for air but face strong bearish pressure
- GBP/USD bulls are taking up the baton but vs. string bearish momentum.
- Bears are pushing the bulls to the edge of the abyss on the longer-term time frames.

GBP/USD has been pushed into cycle lows on Thursday ahead of major data from the US on Friday. While there are no signs of an imminent correction on the longer time frames, the 4-hour chart is starting to pull back which gives rise to a potential opportunity to the upside.
The following illustrates the price action and structures on the weekly, daily and 4-hour charts.
GBP/USD weekly chart
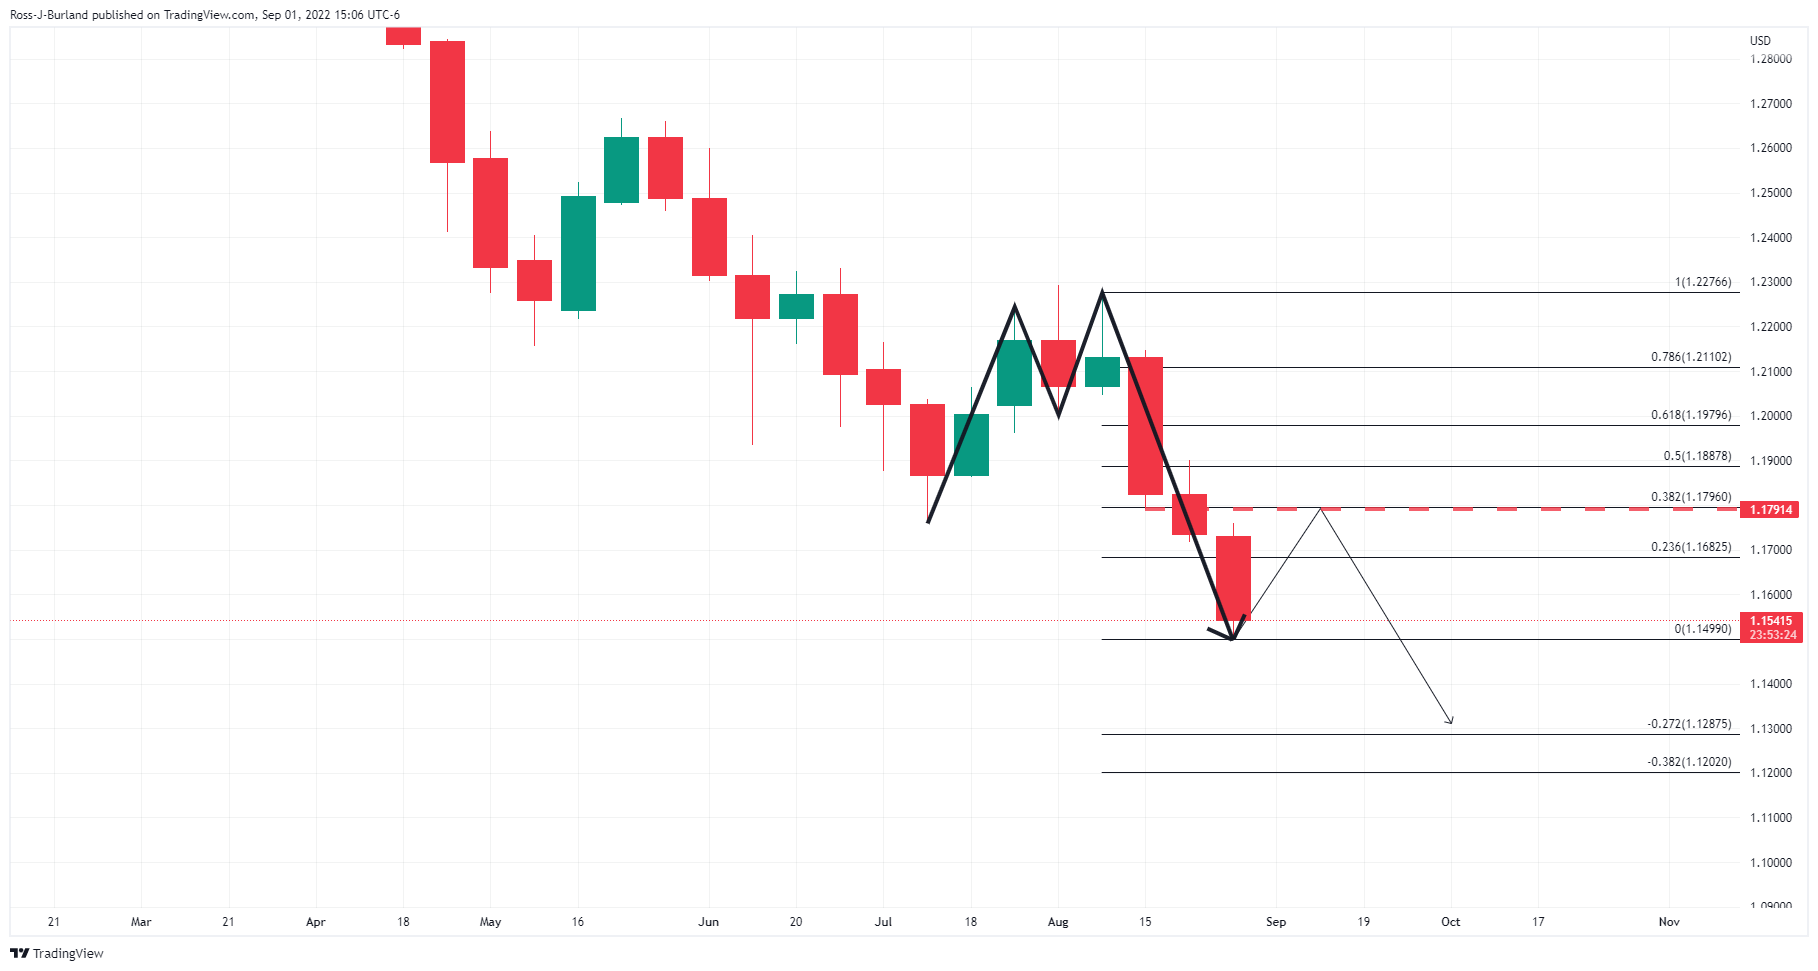
The weekly chart has left an M-formation behind from the past few weeks of price action. This is a reversion pattern that would be expected to pull the price back towards the neckline in due course. Currently, prior lows of mid-August business align with a 38.25 Fibonacci level.
GBP/USD daily chart
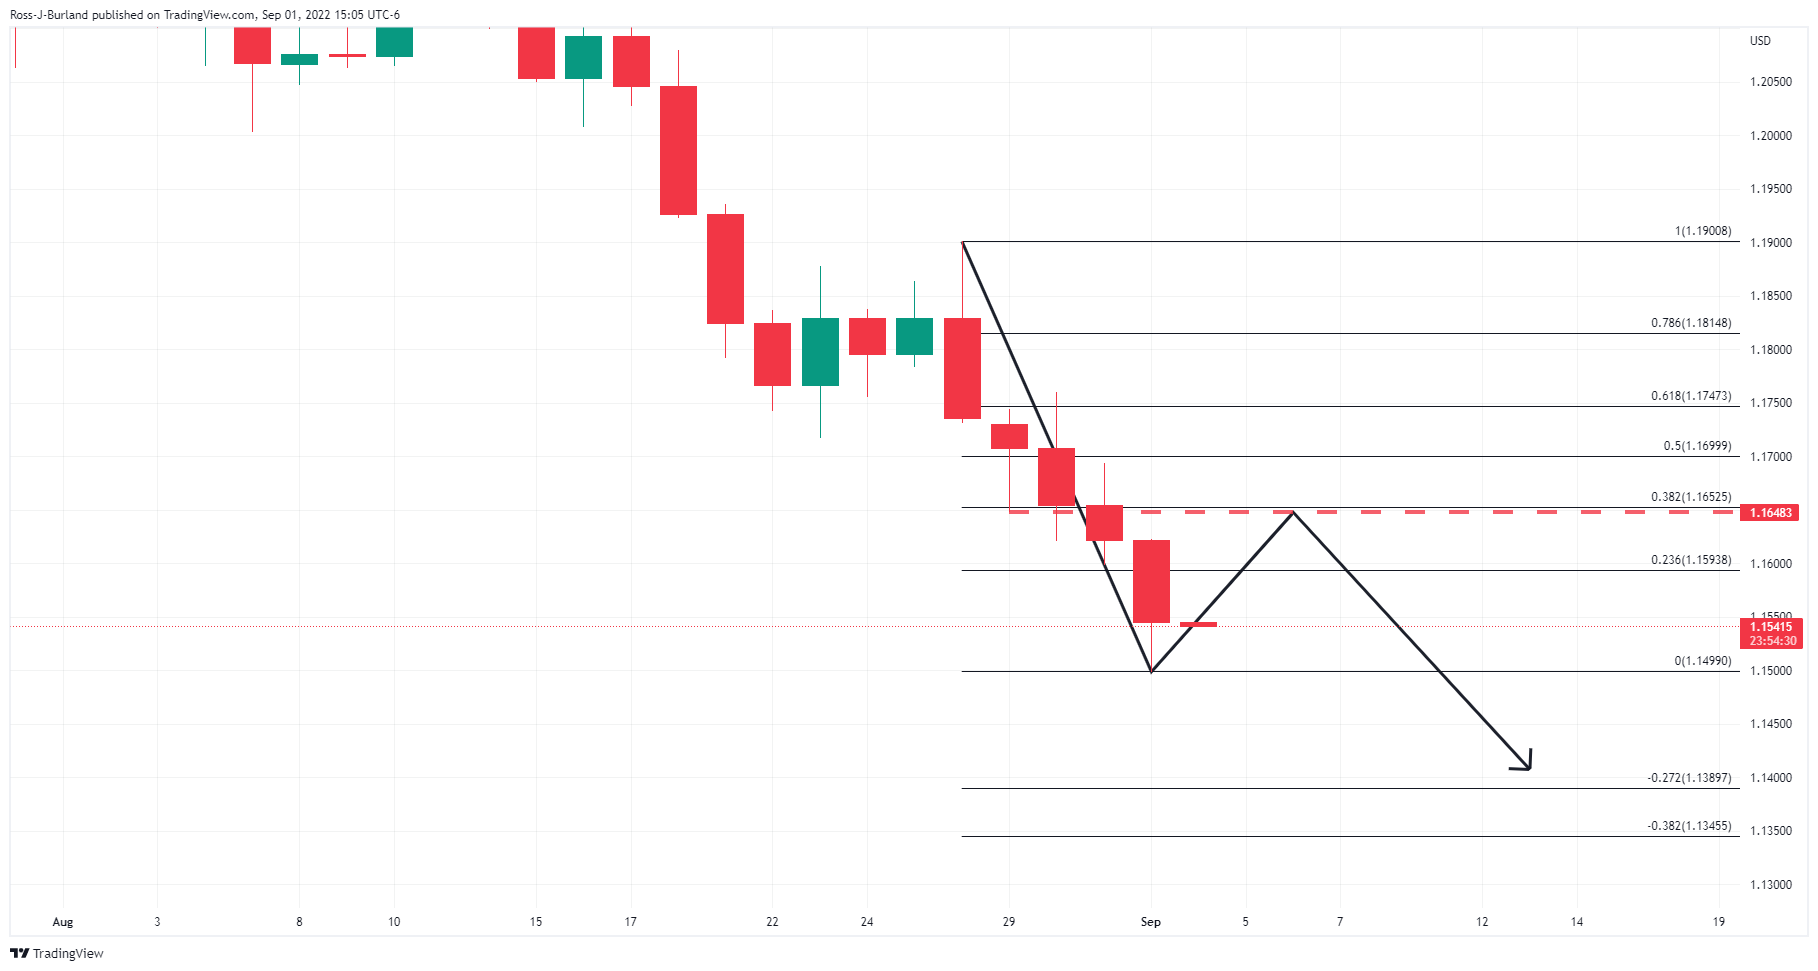
From a daily perspective, the M-formation is over-extended and has started to correct the price higher.
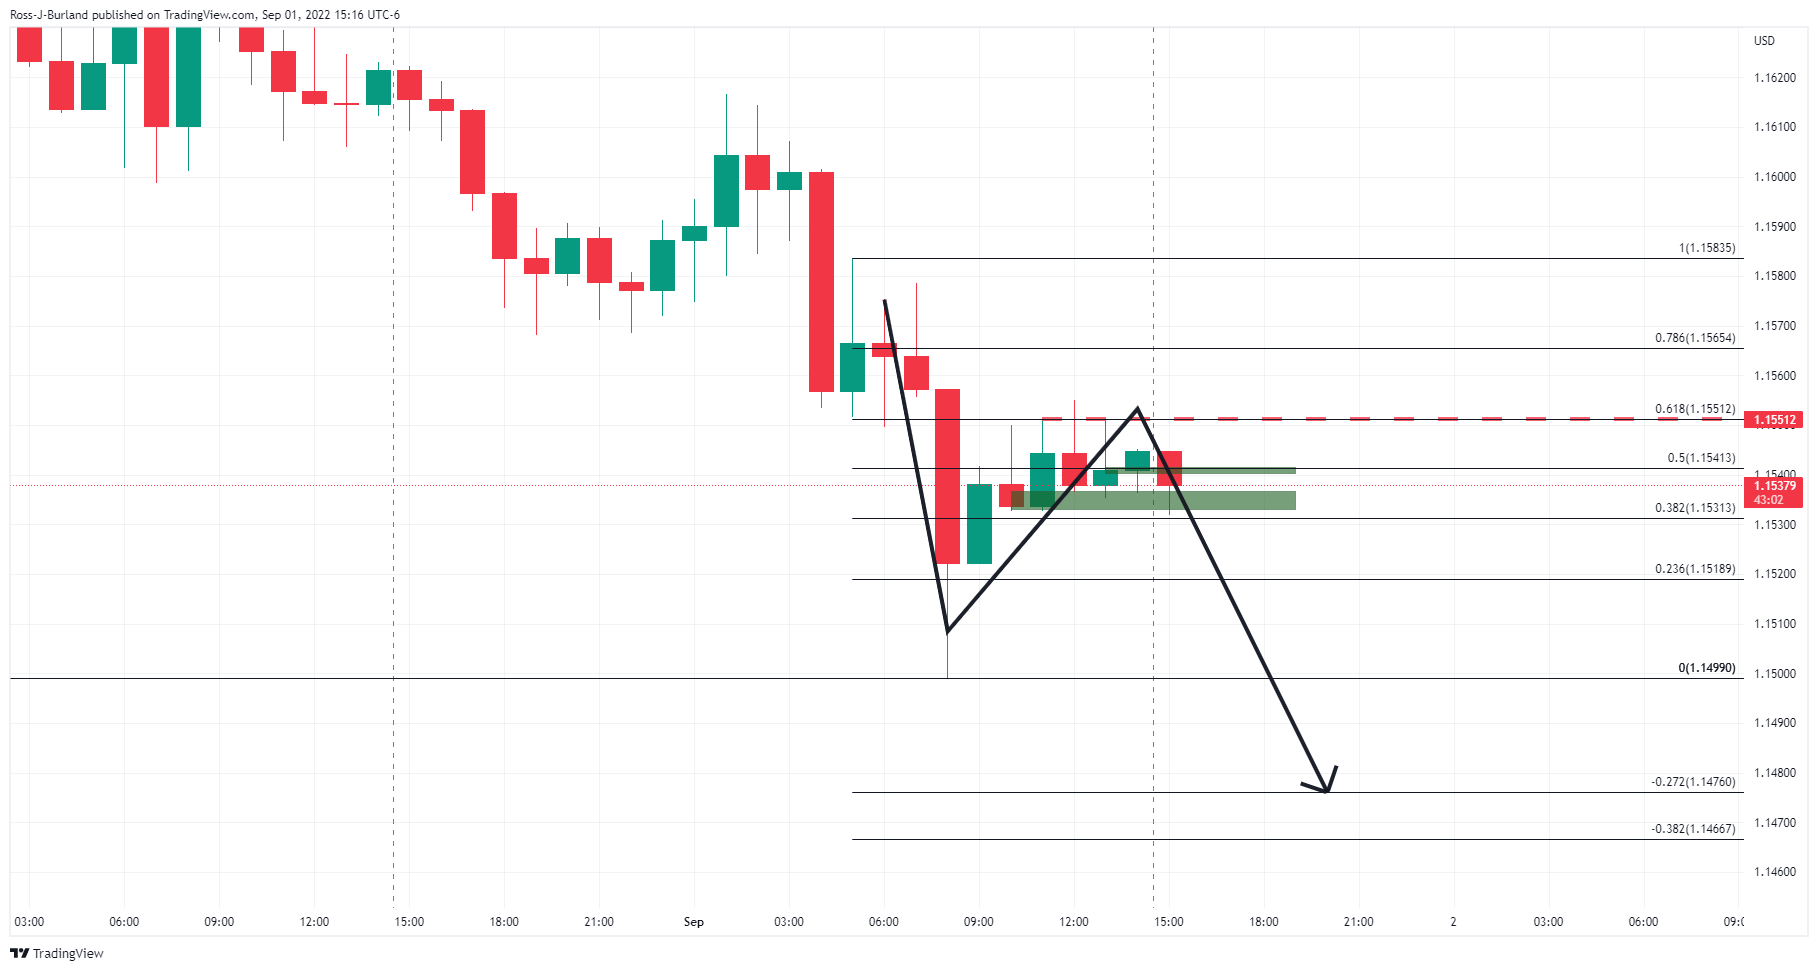
GBP/USD H4 chart
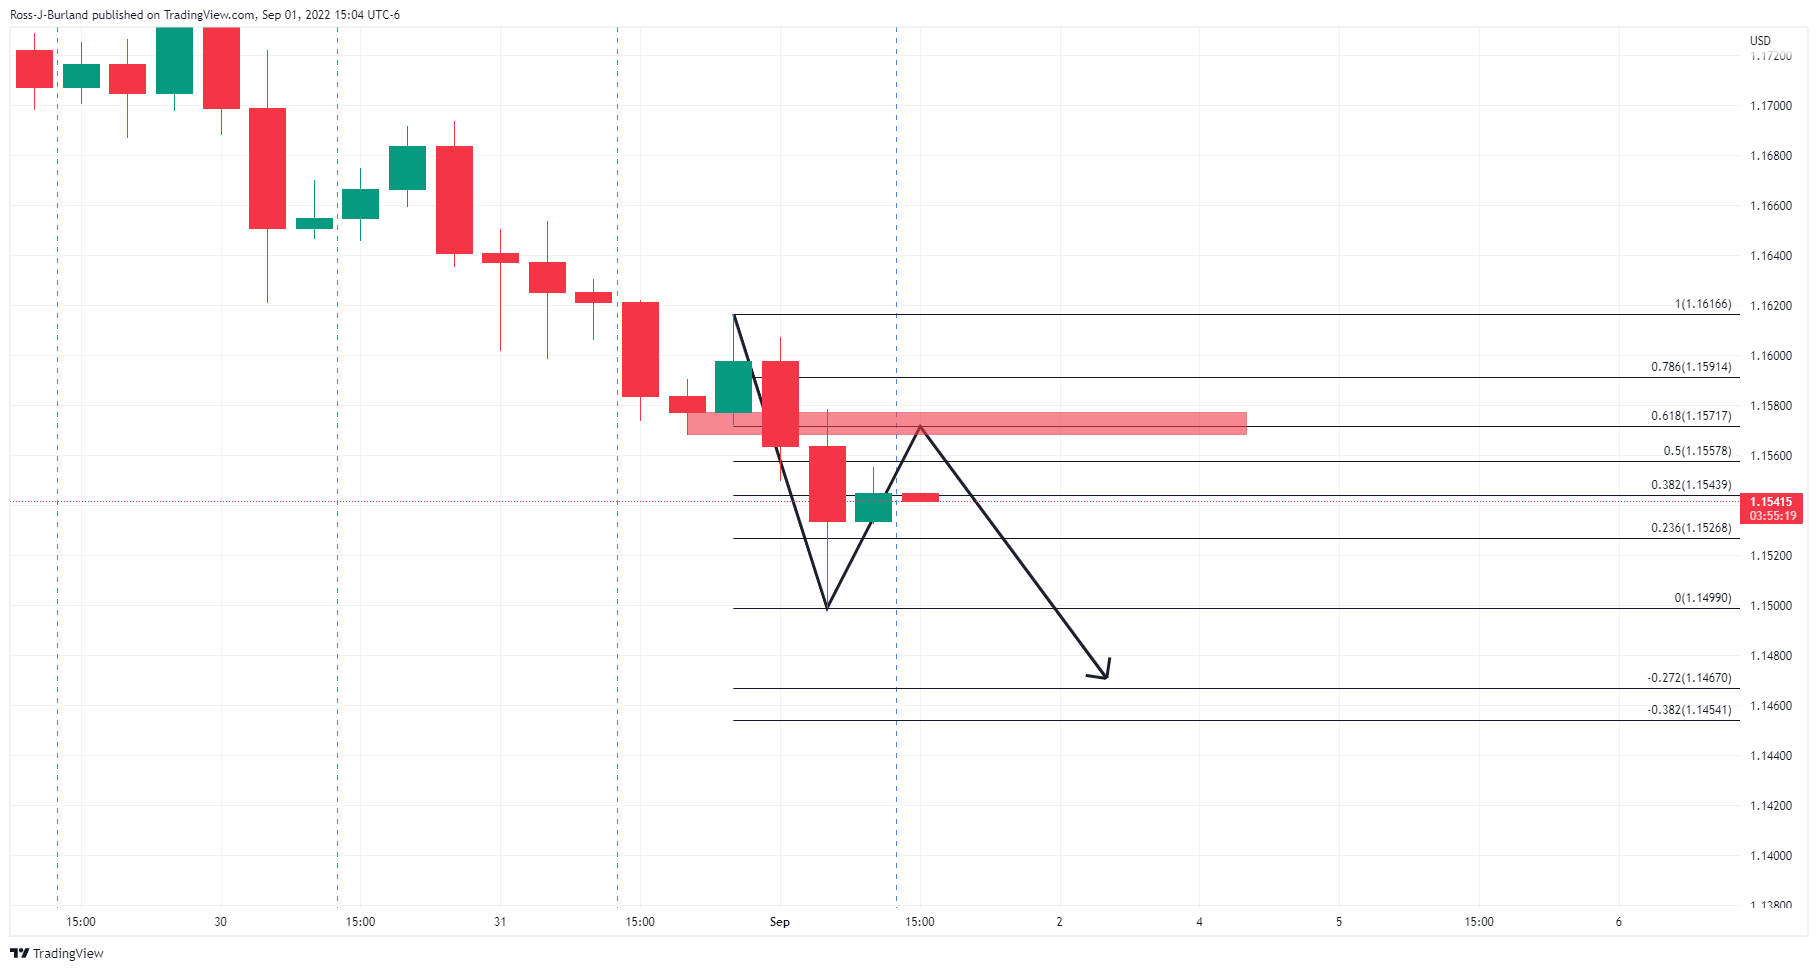
The 4-hour chart sees the price moving in towards a prior support level that currently aligns with the 61.8% Fibonacci retracement level near 1.1570 which could be targetted for the day ahead.
However, the bulls will need to get over the 61.8% ratio on the hourly time frame first or face a potential downside continuation the forthcoming sessions:
Author

Ross J Burland
FXStreet
Ross J Burland, born in England, UK, is a sportsman at heart. He played Rugby and Judo for his county, Kent and the South East of England Rugby team.


