GBP/USD Price Analysis: Bulls and bears battle it out between 1.3150/1.3250
- GBP/USD is on the way to test daily resistance and eye son 1.3250.
- The bears will need to see a break below 1.3150.

GBP/USD, for the most part, is consolidating. There is little prospect of a breakout, one way or another until the parameters of the sideways price action are broken. The following illustrates the outlook from a long=term to a nearer-term perspective.
GBP/USD daily chart
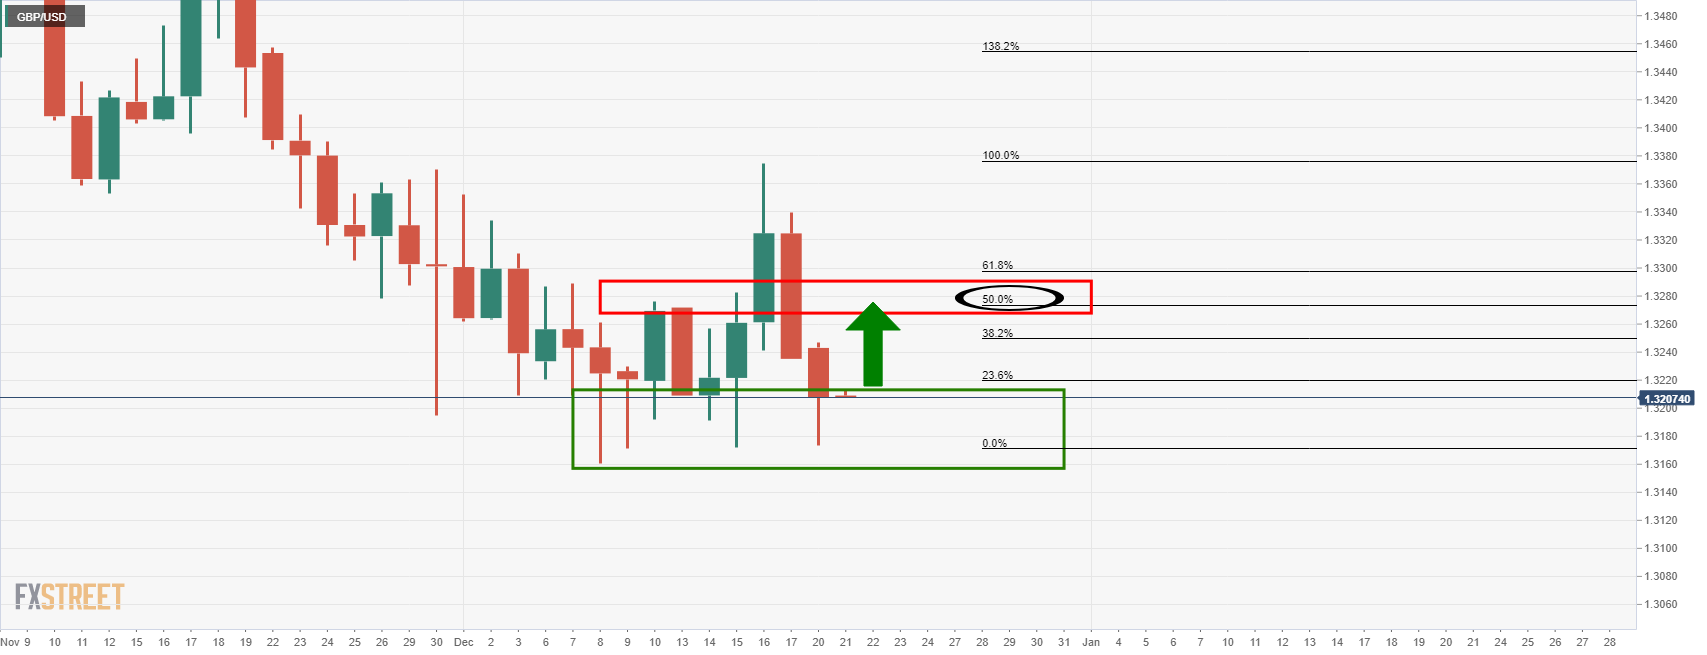
The price is stalling in support and there is the potential for it to climb back to a 50% mean reversion level in the coming sessions if the bulls commit.
There are bearish headwinds from the fundamental side, so a quick recovery in the absence of positive news on the Brexit or Omricon front will be unlikely. With that being said, holiday then markets can go either way, so traders will be wary of the potential for volatility.
Moving down to the hourly chart, there is certainly an upside bias:
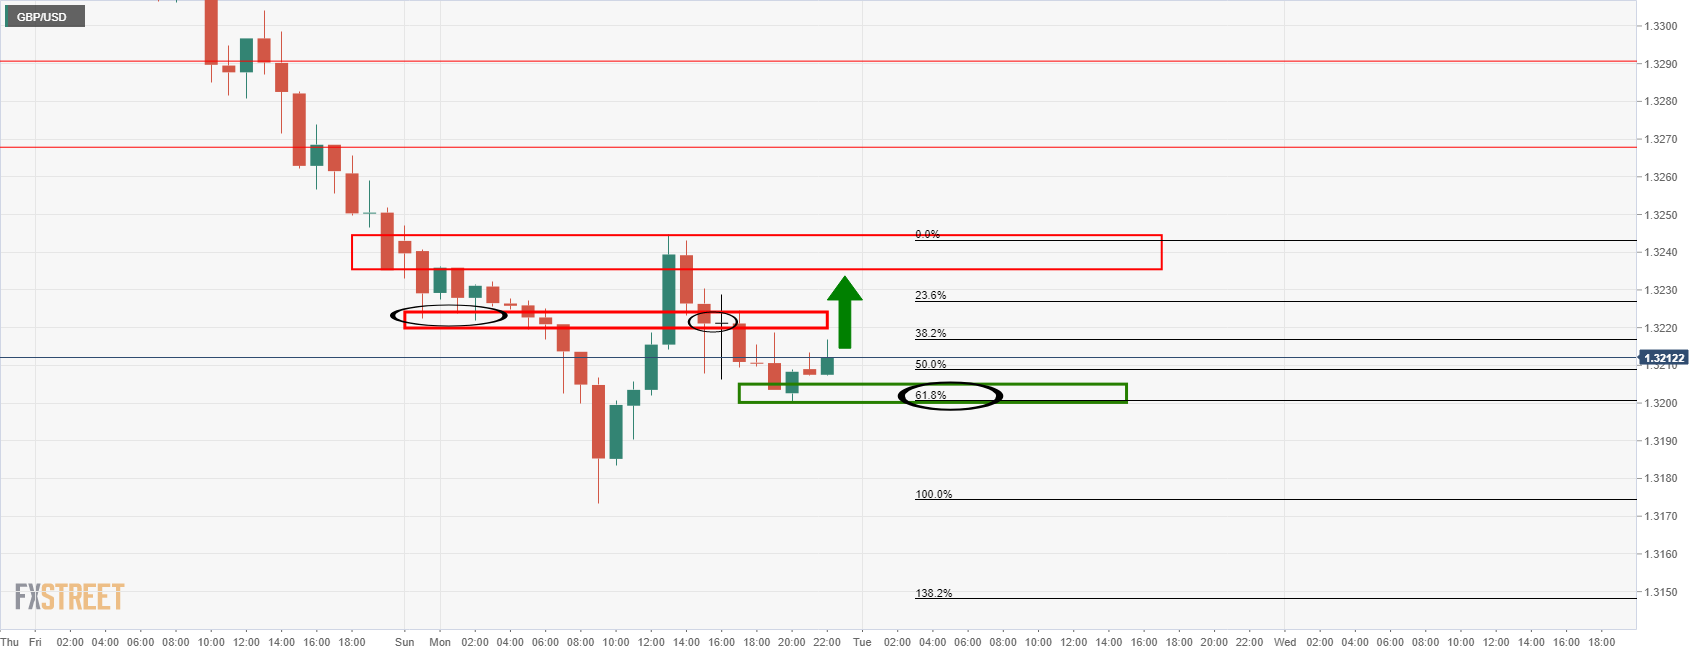
The 61.8% Fibonacci was hit and the bulls have moved in. The question now is whether they can stay the course and penetrate 1.3220 resistance? In doing so, then the daily 1.3240/50s will be a target.
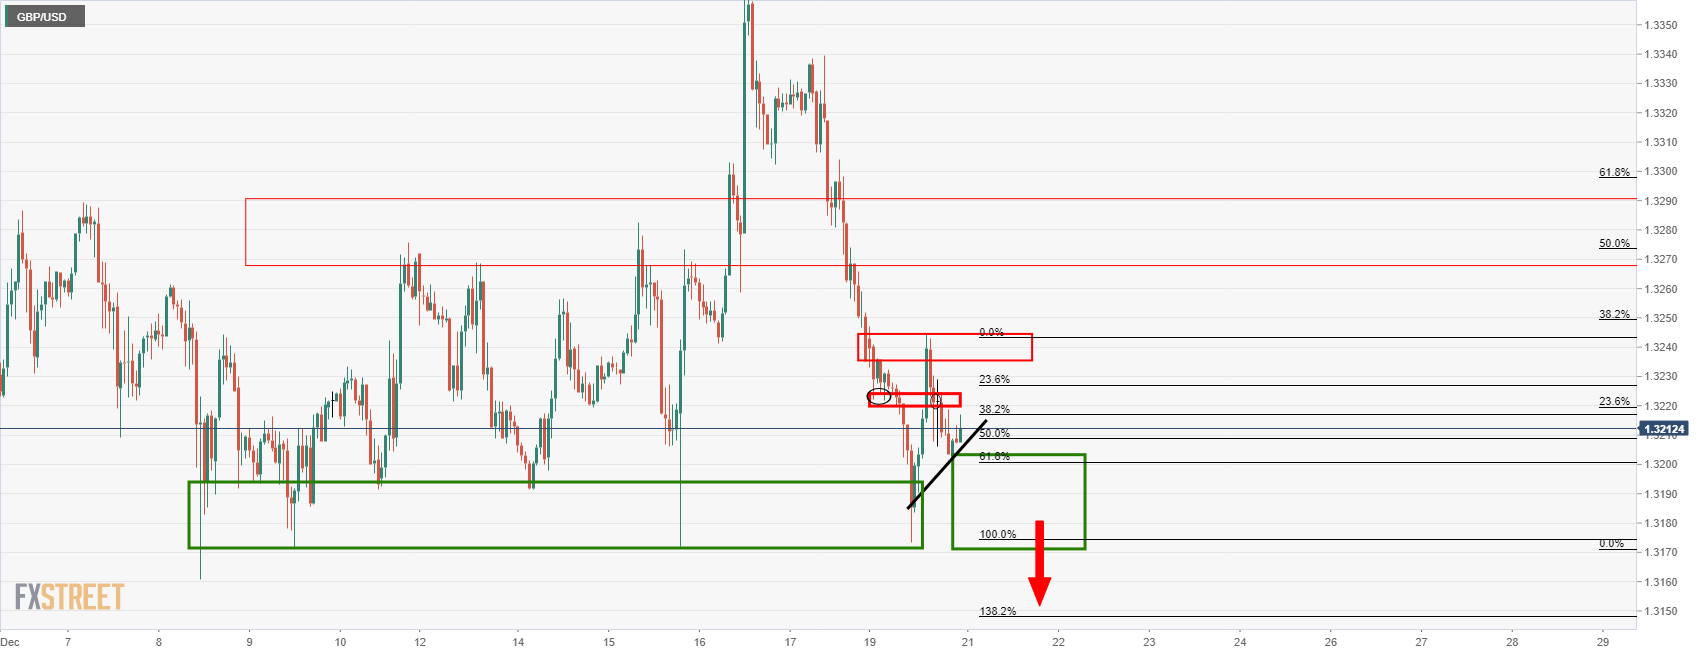
Should the support of the dynamic trendline give out, then there is a risk of a test of the daily support and a run to 1.3150 and below.
GBP/USD weekly chart
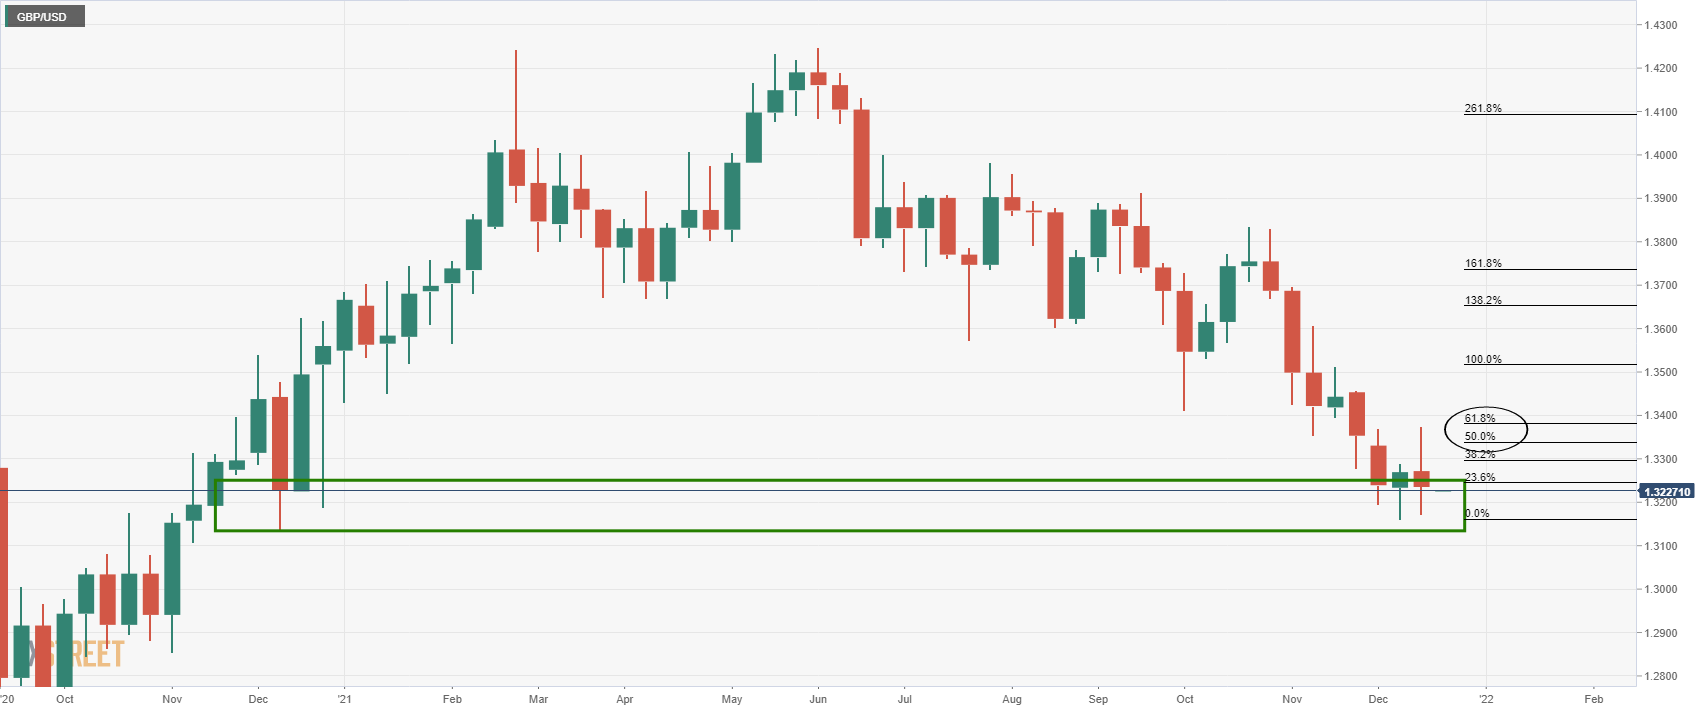
As illustrated, below 1.3200 and 1.3100, there is an imbalance in price towards 1.2850 where the market could fall into should the support structure give out.
Author

Ross J Burland
FXStreet
Ross J Burland, born in England, UK, is a sportsman at heart. He played Rugby and Judo for his county, Kent and the South East of England Rugby team.


