|

GBP/USD Price Analysis: Builds on UK CPI-inspired rally, climbs to 1.2300 ahead of FOMC

  • A combination of supporting factors pushes GBP/USD to its highest level since early February.
  • The strong UK CPI lifts bets for more BoE rate hikes and provides a goodish lift to the Sterling.
  • The prevalent USD selling bias remains supportive of the move ahead of the FOMC decision.

The GBP/USD pair catches fresh bids on Wednesday and the buying interest picks up pace during the first half of the European session in reaction to the strong UK consumer inflation figures. The momentum lifts spot prices to a fresh high since February 02, with bulls now awaiting a sustained strength beyond the 1.2300 mark before positioning for any further appreciating move.

The hotter-than-expected UK CPI print adds pressure on the Bank of England (BoE) to hike interest rates by 25 bps at the very least on Thursday, which, in turn, boosts the British Pound. The US Dollar (USD), on the other hand, drops to a fresh multi-week low amid expectations for a less hawkish Fed and further pushes the GBP/USD pair higher ahead of the key central bank event risks. 

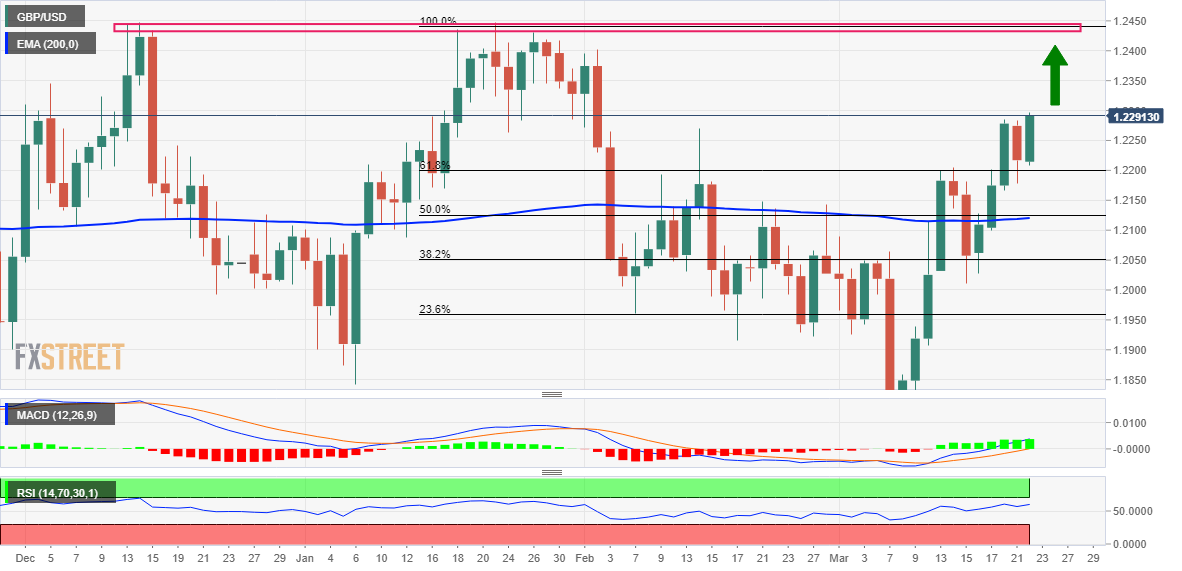
From a technical perspective, the emergence of fresh buying on Wednesday validates this week's breakout through the 1.2200 mark, representing the 61.8% Fibonacci retracement level of the January-March downfall. Given that positive oscillators on the daily chart are still far from being in the overbought zone, some follow-through buying beyond the 1.2300 level will be seen as a fresh trigger for bulls.

The GBP/USD pair might then climb to test the next relevant hurdle near the 1.2320 region before eventually climbing to the 1.2400 round-figure mark. The momentum could get extended further towards the double-top resistance near the 1.2450 region, or the YTD peak touched in January, above which bulls are likely to aim to reclaim the 1.2500 psychological mark for the first time since June 2022.

On the flip side, the 1.2235 area now seems to protect the immediate downside ahead of the 1.2200 mark (61.8% Fibo.) and the overnight swing low, around the 1.2180-1.2175 region. A convincing break below might prompt some technical selling and drag the GBP/USD pair towards the 1.2125 confluence, comprising the 50% Fibo. level and the 200-day Exponential Moving Average (SMA).

The latter should act as a strong base for the GBP/USD pair, which if broken decisively might shift the near-term bias back in favour of bearish traders and pave the way for deeper losses. The subsequent downfall could drag spot prices further towards the 38.2% Fibo. level, around the 1.2050-1.2045 region en route to the 1.2000 psychological mark and the 23.6% Fibo. level, near the 1.1955-1.1950 zone.

GBP/USD daily chart

fxsoriginal

Key levels to watch

GBP/USD

Overview
Today last price1.2281
Today Daily Change0.0064
Today Daily Change %0.52
Today daily open1.2217
 
Trends
Daily SMA201.2046
Daily SMA501.2144
Daily SMA1001.2064
Daily SMA2001.1893
 
Levels
Previous Daily High1.2283
Previous Daily Low1.2179
Previous Weekly High1.2204
Previous Weekly Low1.201
Previous Monthly High1.2402
Previous Monthly Low1.1915
Daily Fibonacci 38.2%1.2218
Daily Fibonacci 61.8%1.2243
Daily Pivot Point S11.217
Daily Pivot Point S21.2122
Daily Pivot Point S31.2066
Daily Pivot Point R11.2274
Daily Pivot Point R21.233
Daily Pivot Point R31.2378

Author

Haresh Menghani

Haresh Menghani is a detail-oriented professional with 10+ years of extensive experience in analysing the global financial markets.

More from Haresh Menghani
Share:

Markets move fast. We move first.

Orange Juice Newsletter brings you expert driven insights - not headlines. Every day on your inbox.

By subscribing you agree to our Terms and conditions.

Editor's Picks

EUR/USD climbs toward 1.1800 on broad USD weakness

EUR/USD gathers bullish momentum and advances toward 1.1800 in the second half of the day on Tuesday. The US Dollar weakens and helps the pair stretch higher after the employment report showed that Nonfarm Payrolls declined by 105,000 in October before rising by 64,000 in November.

GBP/USD climbs to fresh two-month high above 1.3400

GBP/USD gains traction in the American session and trades at its highest level since mid-October above 1.3430. The British Pound benefits from upbeat PMI data, while the US Dollar struggles to find demand following the mixed employment figures and weaker-than-forecast PMI prints, allowing the pair to march north.

Gold recovers above $4,300 as markets react to weak US data

Gold trades in positive above $4,300 after spending the first half of the day under bearish pressure. XAU/USD capitalizes on renewed USD weakness after the jobs report showed that the Unemployment Rate climbed to 4.6% in November and the PMI data revealed a loss of growth momentum in the private sector in December. 

US Retail Sales virtually unchanged at $732.6 billion in October

Retail Sales in the United States were virtually unchanged at $732.6 billion in October, the US Census Bureau reported on Tuesday. This print followed the 0.1% increase (revised from 0.3%) recorded in September and came in below the market expectation of +0.1%.

Ukraine-Russia in the spotlight once again

Since the start of the week, gold’s price has moved lower, but has yet to erase the gains made last week. In today’s report we intend to focus on the newest round of peace talks between Russia and Ukraine, whilst noting the release of the US Employment data later on day and end our report with an update in regards to the tensions brewing in Venezuela.

BNB Price Forecast: BNB slips below $855 as bearish on-chain signals and momentum indicators turn negative

BNB, formerly known as Binance Coin, continues to trade down around $855 at the time of writing on Tuesday, after a slight decline the previous day. Bearish sentiment further strengthens as BNB’s on-chain and derivatives data show rising retail activity.