GBP/USD Price Analysis: Braces for a bumpy road to south, 200-DMA in the spotlight


  • GBP/USD consolidates the biggest daily loss in a fortnight around weekly low.
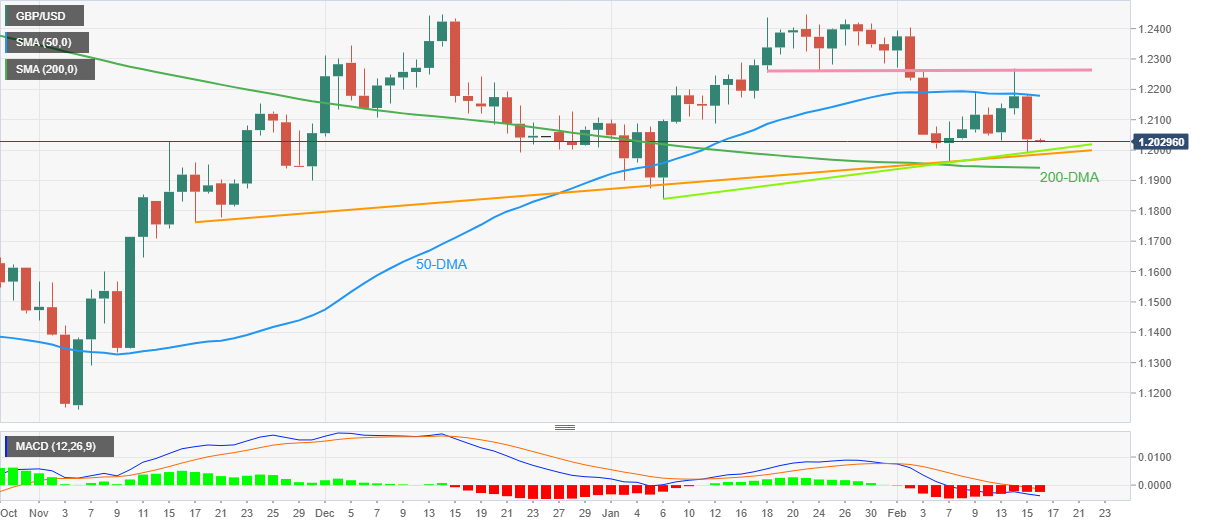
  • Ascending trend lines from January and last November precede 200-DMA to challenge bears.
  • U-turn from 50-DMA, bearish MACD signals favor sellers.

GBP/USD stays defensive around 1.2030, bouncing off the weekly low, as it licks the previous day’s wounds during early Thursday.

In doing so, the Cable pair rebounds from a six-week-old support line after falling the most in a fortnight. The recovery moves, however, remain elusive considering the quote’s sustained U-turn from the 50-DMA and the bearish MACD signals.

It’s worth noting, though, that the ascending support lines from early January and mid-November 2022, respectively around 1.2000 and 1.1985 in that order, restrict the short-term downside of the GBP/USD pair.

Following that, the 200-DMA level of 1.1940 gains the major attention of the bears targeting the mid-November 2022 bottom around 1.1760. However, the previous monthly low surrounding 1.1840 could offer an intermediate halt during the fall.

Meanwhile, GBP/USD recovery remains elusive unless crossing the 50-DMA hurdle of near 1.2180.

In a case where the GBP/USD price remains firmer past 50-DMA, a one-month-old horizontal resistance near 1.2260 will be in focus as it holds the key for the Cable pair’s run-up toward the multiple tops marked since late 2022 around 1.2450.

Overall, GBP/USD is likely to remain depressed but the downside room appears limited.

GBP/USD: Daily chart

Trend: Limited downside expected

Additional important levels

Overview
Today last price 1.2034
Today Daily Change -0.0143
Today Daily Change % -1.17%
Today daily open 1.2177
 
Trends
Daily SMA20 1.2249
Daily SMA50 1.2186
Daily SMA100 1.1874
Daily SMA200 1.1943
 
Levels
Previous Daily High 1.227
Previous Daily Low 1.2118
Previous Weekly High 1.2194
Previous Weekly Low 1.1961
Previous Monthly High 1.2448
Previous Monthly Low 1.1841
Daily Fibonacci 38.2% 1.2212
Daily Fibonacci 61.8% 1.2176
Daily Pivot Point S1 1.2107
Daily Pivot Point S2 1.2036
Daily Pivot Point S3 1.1954
Daily Pivot Point R1 1.2259
Daily Pivot Point R2 1.234
Daily Pivot Point R3 1.2411


Share: Feed news

Information on these pages contains forward-looking statements that involve risks and uncertainties. Markets and instruments profiled on this page are for informational purposes only and should not in any way come across as a recommendation to buy or sell in these assets. You should do your own thorough research before making any investment decisions. FXStreet does not in any way guarantee that this information is free from mistakes, errors, or material misstatements. It also does not guarantee that this information is of a timely nature. Investing in Open Markets involves a great deal of risk, including the loss of all or a portion of your investment, as well as emotional distress. All risks, losses and costs associated with investing, including total loss of principal, are your responsibility. The views and opinions expressed in this article are those of the authors and do not necessarily reflect the official policy or position of FXStreet nor its advertisers. The author will not be held responsible for information that is found at the end of links posted on this page.

If not otherwise explicitly mentioned in the body of the article, at the time of writing, the author has no position in any stock mentioned in this article and no business relationship with any company mentioned. The author has not received compensation for writing this article, other than from FXStreet.

FXStreet and the author do not provide personalized recommendations. The author makes no representations as to the accuracy, completeness, or suitability of this information. FXStreet and the author will not be liable for any errors, omissions or any losses, injuries or damages arising from this information and its display or use. Errors and omissions excepted.

The author and FXStreet are not registered investment advisors and nothing in this article is intended to be investment advice.

Recommended content


Recommended content

Editors’ Picks

EUR/USD extends gains above 1.0700, focus on key US data

EUR/USD extends gains above 1.0700, focus on key US data

EUR/USD meets fresh demand and rises toward  1.0750 in the European session on Thursday. Renewed US Dollar weakness offsets the risk-off market environment, supporting the pair ahead of the key US GDP and PCE inflation data. 

EUR/USD News

GBP/USD extends recovery above 1.2500, awaits US GDP data

GBP/USD extends recovery above 1.2500, awaits US GDP data

GBP/USD is catching a fresh bid wave, rising above 1.2500 in European trading on Thursday. The US Dollar resumes its corrective downside, as traders resort to repositioning ahead of the high-impact US advance GDP data for the first quarter. 

GBP/USD News

Gold price edges higher amid weaker USD and softer risk tone, focus remains on US GDP

Gold price edges higher amid weaker USD and softer risk tone, focus remains on US GDP

Gold price (XAU/USD) attracts some dip-buying in the vicinity of the $2,300 mark on Thursday and for now, seems to have snapped a three-day losing streak, though the upside potential seems limited. 

Gold News

Injective price weakness persists despite over 5.9 million INJ tokens burned

Injective price weakness persists despite over 5.9 million INJ tokens burned

Injective price is trading with a bearish bias, stuck in the lower section of the market range. The bearish outlook abounds despite the network's deflationary efforts to pump the price. 

Read more

US Q1 GDP Preview: Economic growth set to remain firm in, albeit easing from Q4

US Q1 GDP Preview: Economic growth set to remain firm in, albeit easing from Q4

The United States Gross Domestic Product (GDP) is seen expanding at an annualized rate of 2.5% in Q1. The current resilience of the US economy bolsters the case for a soft landing. 

Read more

Forex MAJORS

Cryptocurrencies

Signatures