|

GBP/USD Price Analysis: Bears take control below monthly support

  • GBP/USD bears are in control, for now, and aim for a monthly support area. 
  • The daily chart's M-formation's neckline is important. 

GBP/USD is performing on the bid on Thursday afternoon US session, trying to resurface from the recent lows around 1.3050 following a strong move in the greenback. Meanwhile, however, the pair remains vulnerable to further losses from a longer-term perspective and the following illustrates the market structures across the monthly, weekly and potentially, from a daily point of view also. 

GBP/USD monthly chart

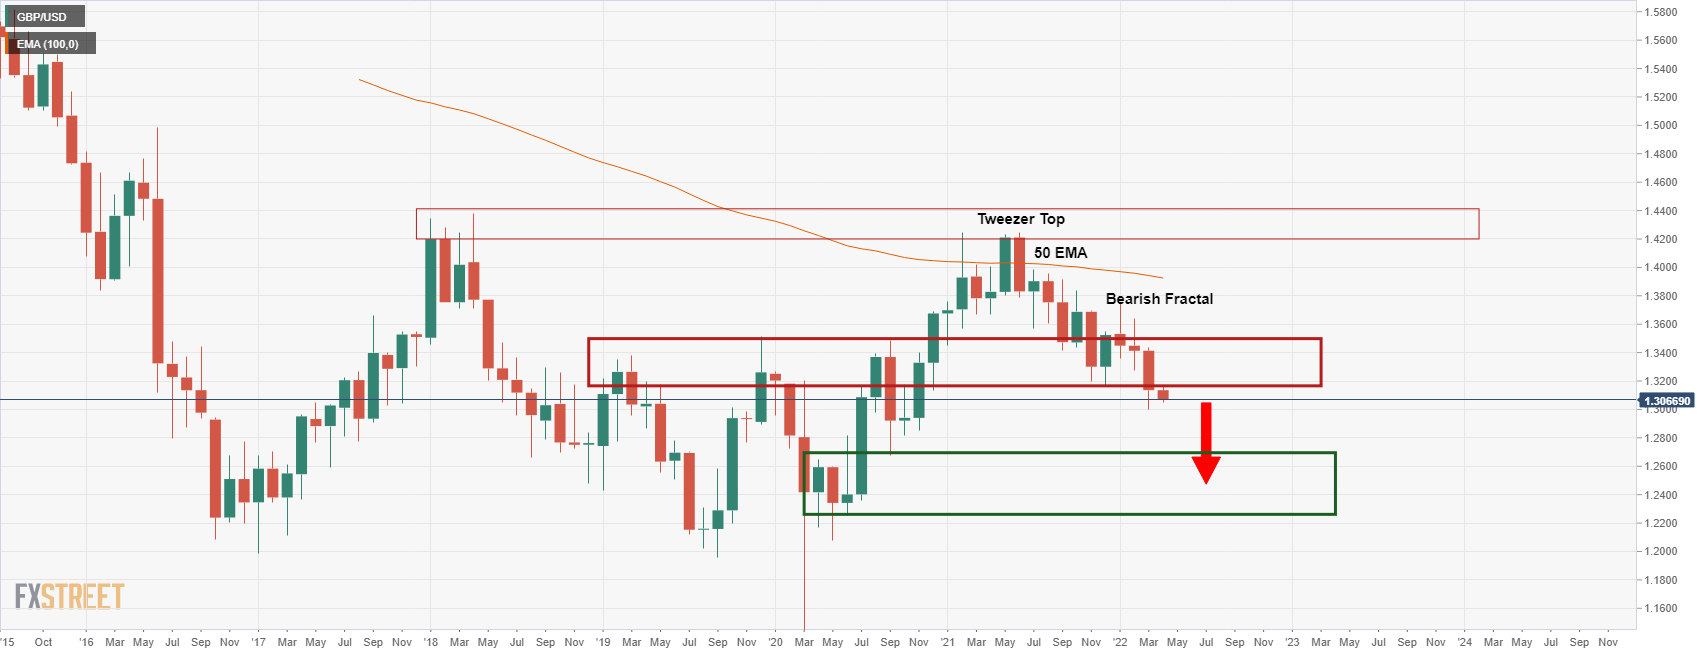
The monthly chart is highly bearish following a restest into the 50 EMA, followed by the Tweezer Top and a bearish Fractal. The pair has subsequently continued south and broken support that now would be expected to act as resistance on a subsequent retest of the structure. 

GBP/USD weekly chart

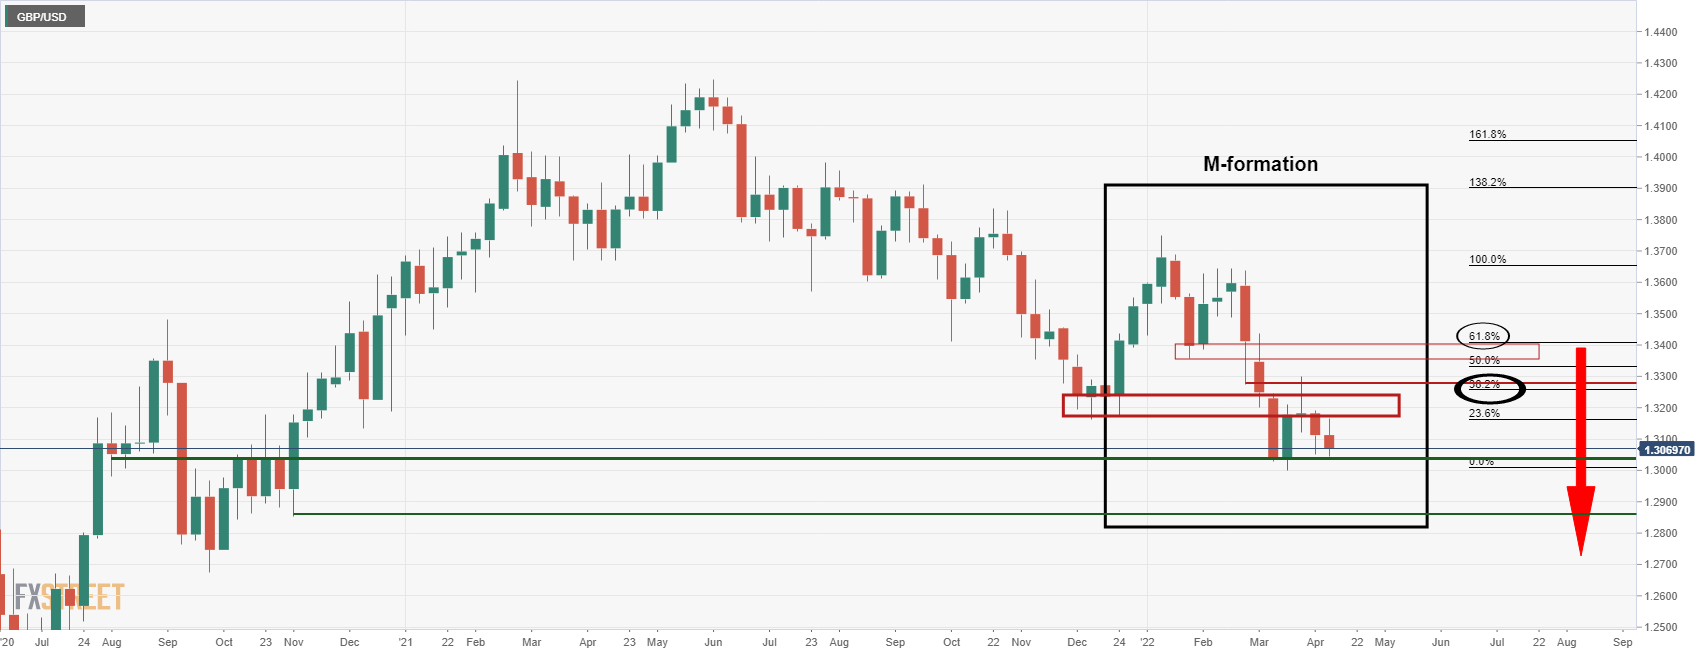
Meanwhile, the weekly chart's M-formation, a reversion pattern, has seen the price revert towards the neckline in a 38.2% Fibonacci retracement. This is potentially far enough to lure in the bears at a discount and thus see prices extend lower in the coming weeks towards the monthly support area. 

GBP/USD daily chart

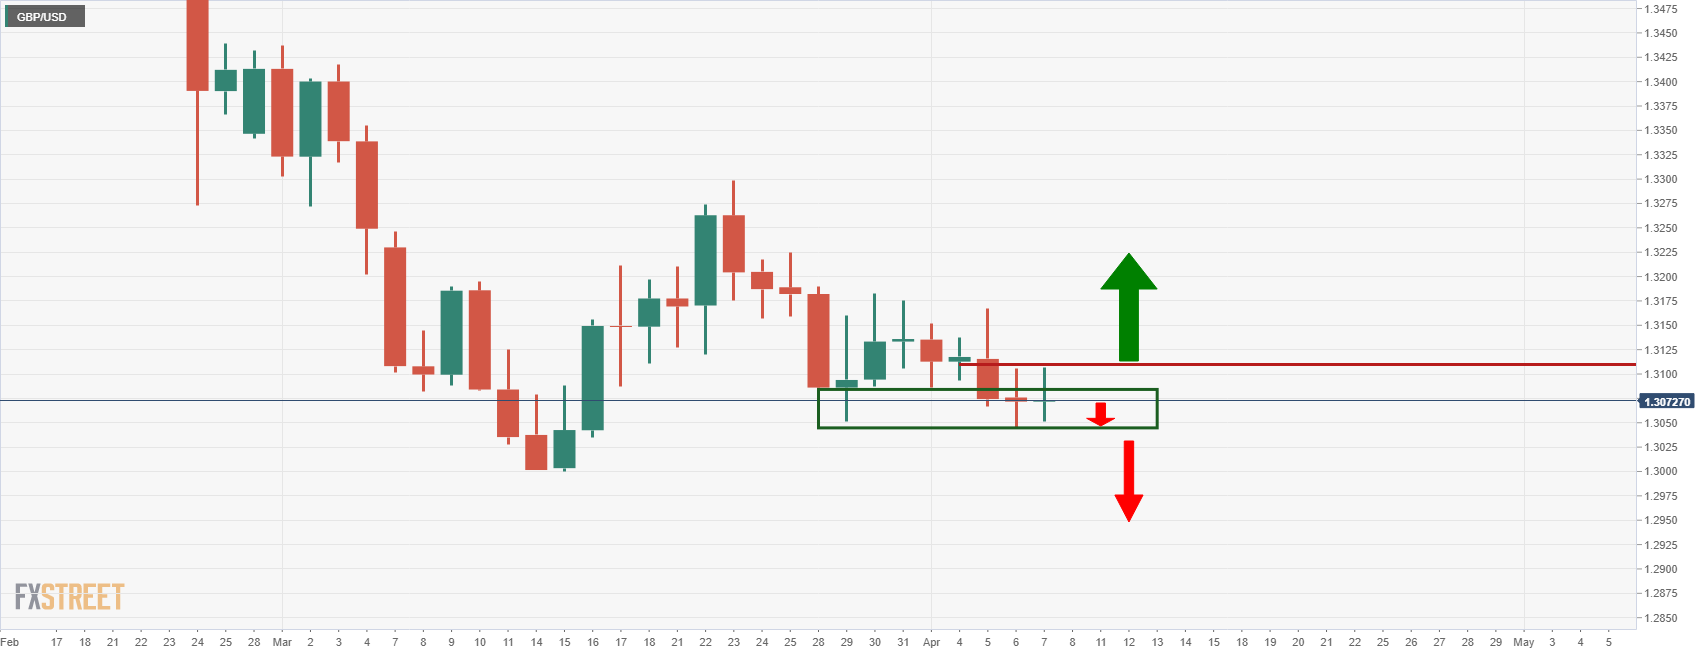
From a daily point of view, however, there could still be some upside to come as the price is drawn to the M-formation's neckline. This will need to hold on a retest and bears will need to protect this area if the downside is going to play out in the foreseeable future. If the price breaks the neckline, then the bulls could well take back control in the meantime. 

Author

Ross J Burland

Ross J Burland, born in England, UK, is a sportsman at heart. He played Rugby and Judo for his county, Kent and the South East of England Rugby team.

More from Ross J Burland
Share:

Editor's Picks

AUD/USD falls to near 0.7100 after slipping below 50-day EMA

AUD/USD depreciates after registering minor gains in the previous day, trading around 0.7120 during the Asian hours. The technical analysis of the daily chart shows the pair consolidating sideways within a rectangle pattern, as neither bulls nor bears gain control. The AUD/USD pair is holding a slight bearish tone however as it sits beneath both the nine-day and 50-day EMAs.

160.00: USD/JPY back near intervention territory after upbeat US jobs report

US Nonfarm Payrolls beat expectations by a wide margin in May, with 172K jobs added. The US Dollar rebounds after the release, helping USD/JPY recover from its intraday lows. Warnings from Japanese authorities continue to limit upside potential near the 160.00 threshold.

Gold targets $4,300 amid stronger Dollar

Gold faces increasing selling interest and navigates the area of three-month lows near the $4,300 mark per troy ounce on Friday. The precious metal’s decline comes as traders assess the stronger-than-expected NFP, while the bid bias in the Greenback and higher US Treasury yields also collaborate with the retracement.

Cardano hits five-year low even as Hoskinson clarifies "break" isn't an exit

Cardano (ADA) price is down 10% at press time on Friday, extending losses over 30% so far this week amid Charles Hoskinson's clarification that "break" isn't an exit.

Week ahead – Fed countdown begins amid US inflation data and geopolitical risks

Fed Chair Warsh’s first meeting approaches as key US inflation data could reshape expectations. Oil prices remain elevated as US-Iran talks continue; tariffs also return to the spotlight. ECB is expected to hike; will it be a one-off move or is July live?

The US economy defies the rules: 100 days into the Oil shock and the recession signal is still missing

More than three months after the start of the Iran war and the resulting disruption to global energy markets, the US economy continues to display remarkable resilience. The conflict has triggered a sharp rise in Oil prices, reignited inflationary pressures and fueled widespread concerns about a potential economic slowdown.