|

GBP/USD Price Analysis: Bears are moving in on the risk rally

  • GBP/USD bulls hit a brick wall in the Wall Street risk rally.
  • The daily chart offers a bearish scenario for the days ahead. 

GBP/USD is back to flat in the day after initial losses that were sparked in the face of the Bank of England Governor Andrew Bailey reiterating that he expected price pressures to ease, as soon as April. Also, data showed Britain's jobless rate rose to 3.9%, while the rate of increase in total pay held steady. At the time of writing, GBP/USD is trading near 1.2490 and is correcting lower from a 4-hour resistance area. 

GBP/USD daily chart

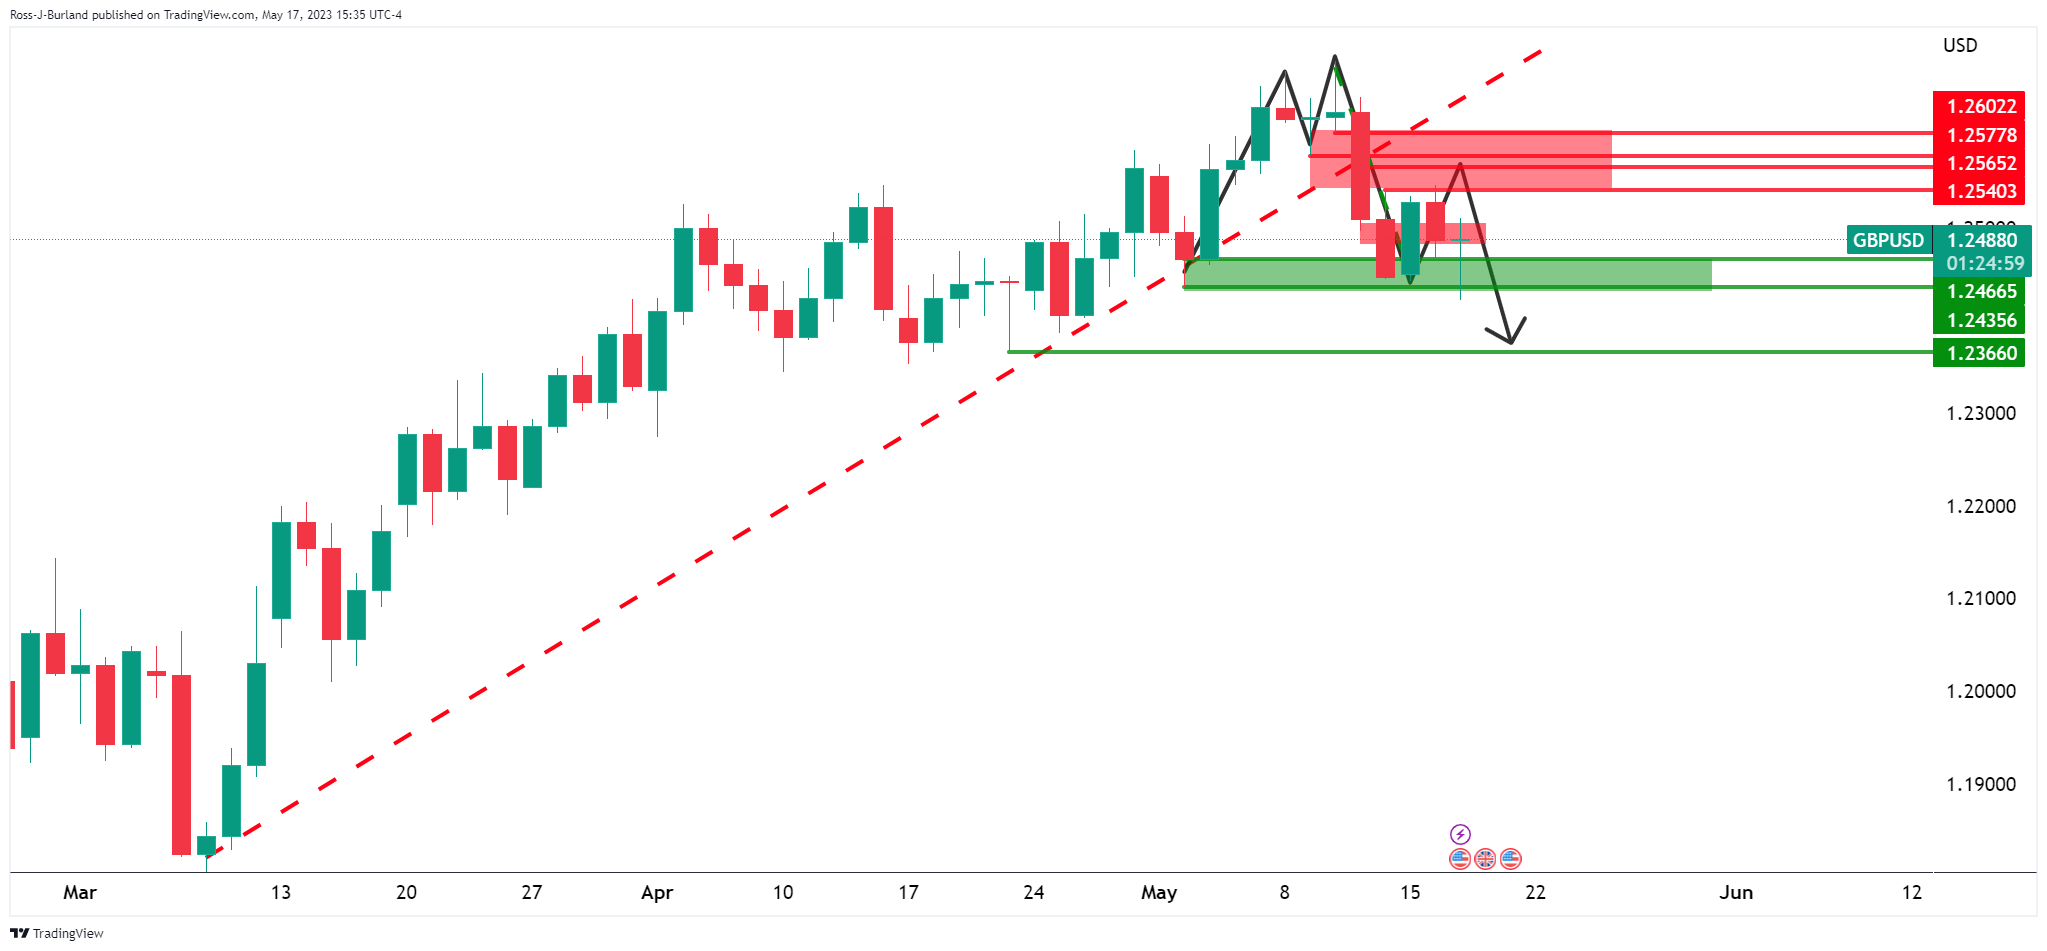
The M-formation is a topping pattern that has formed as the potential for the final stage of the prior bullish rally. The price is now on the backside of that trendline, so shorts could be the more favorable playbook for traders:

GBP/USD H4 chart

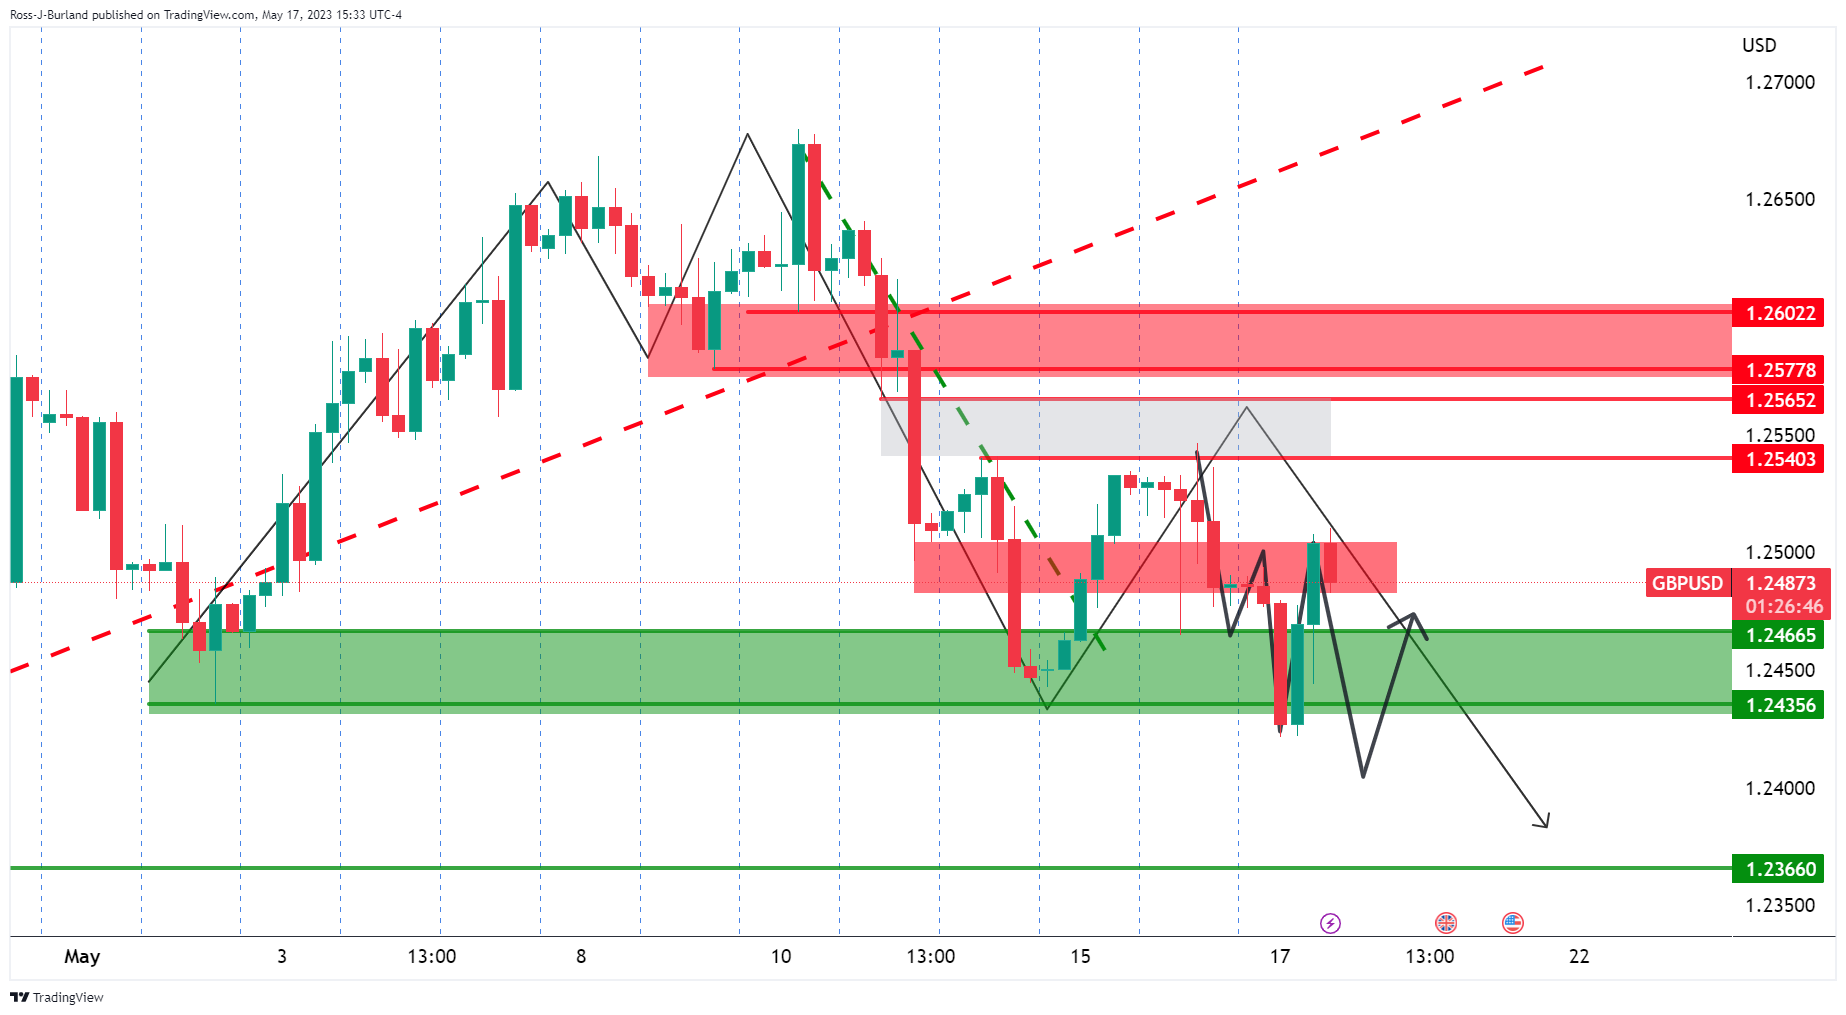
The price has shot up to test resistance and while there are prospects of an onward continuation, the price can easily head lower as illustrated in the chart above. 

Author

Ross J Burland

Ross J Burland, born in England, UK, is a sportsman at heart. He played Rugby and Judo for his county, Kent and the South East of England Rugby team.

More from Ross J Burland
Share:

Markets move fast. We move first.

Orange Juice Newsletter brings you expert driven insights - not headlines. Every day on your inbox.

By subscribing you agree to our Terms and conditions.

Editor's Picks

EUR/USD struggles to extend advance above 1.1800

The EUR/USD pair posts a fresh weekly low near 1.1740 during the Asian trading session on Wednesday. The major currency pair is under pressure as the US Dollar edges higher despite Federal Open Market Committee minutes of the December policy meeting, released on Tuesday, showing that most policymakers stressed the need for further interest rate cuts.

GBP/USD tests 1.3450 support after moving below nine-day EMA

GBP/USD remains subdued for the second consecutive day, trading around 1.3460 during the Asian hours on Wednesday. The technical analysis of the daily chart indicates a weakening of a bullish bias as the pair is positioned slightly below the lower boundary of the ascending channel pattern.

Gold jumps on US rate cut prospects, safe-haven demand

Gold price extends the rally above $4,350 during the early European trading hours on Wednesday. Gold's price has surged about 65% this year and is set to record its biggest annual gains since 1979. The rally in the precious metal is bolstered by the prospect of further US interest rate cuts in 2026. Lower interest rates could reduce the opportunity cost of holding Gold, supporting the non-yielding precious metal.

Bitcoin, Ethereum and XRP prepare for a potential New Year rebound

Bitcoin, Ethereum, and Ripple are holding steady on Wednesday after recording minor gains on the previous day. Technically, Bitcoin could extend gains within a triangle pattern while Ethereum and Ripple face critical overhead resistance. 

Economic outlook 2026-2027 in advanced countries: Solidity test

After a year marked by global economic resilience and ending on a note of optimism, 2026 looks promising and could be a year of solid economic performance. In our baseline scenario, we expect most of the supportive factors at work in 2025 to continue to play a role in 2026.

Crypto market outlook for 2026

Year 2025 was volatile, as crypto often is.  Among positive catalysts were favourable regulatory changes in the U.S., rise of Digital Asset Treasuries (DAT), adoption of AI and tokenization of Real-World-Assets (RWA).