GBP/USD Price Analysis: Attempts a bounce from a critical daily support line
- GBP/USD bounces-off key support near 1.3730, not out of the woods yet.
- Daily closing above 200-DMA could offer temporary respite to GBP bulls.
- RSI remains in the bearish zone, keeping the downside risks intact.

GBP/USD is struggling to extend its bounce above 1.3750, having hit monthly lows at 1.3726 on Tuesday.
The cable is currently trading at 1.3756, up 0.13% on the day, having rebounded from a critical upward-sloping daily support line at 1.3730. The line connects the previous day’s low and July lows.
In doing so, the pair has stalled its two-day decline, although the risks remain skewed to the downside following a daily closing below the 200- Daily Moving Average (DMA) at 1.3768.
Further, the 14-day Relative Strength Index (RSI) edges higher but remains below the midline, keeping the sellers hopeful.
Adding credence to an impending downside breakout, the 50-DMA is fast approaching the 21-DMA, with a break lower to confirm a bear cross – a bearish technical signal.
A daily closing below the abovementioned key support could trigger a fresh sell-off towards the 1.3700 round number.
Sellers will then aim for the July lows at 1.3672 should the downside pressure accelerate.
GBP/USD: Daily chart
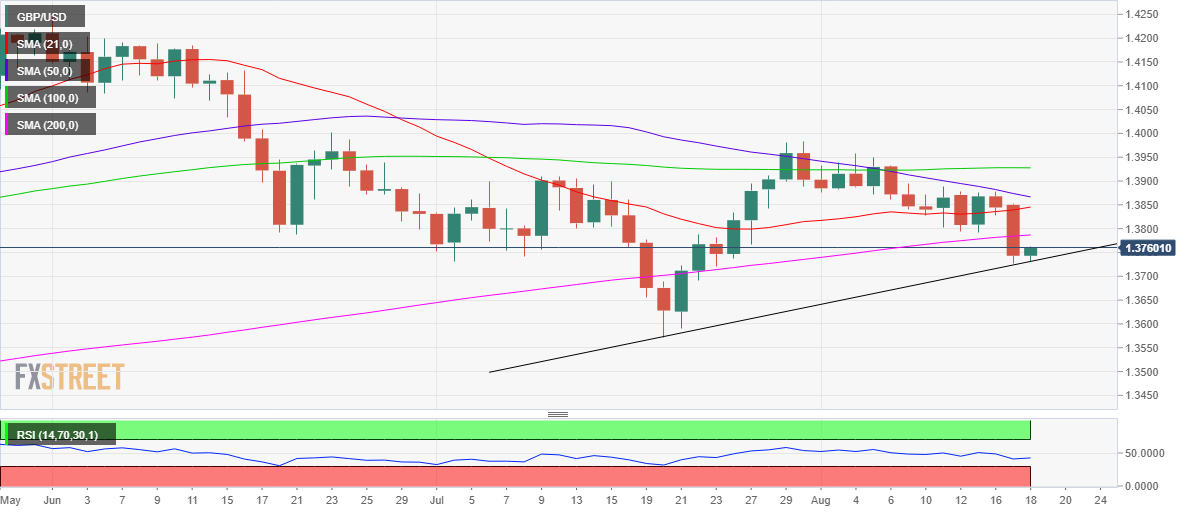
Alternatively, a firm break above the 200-DMA is needed for a temporary respite to the cable buyers.
The horizontal 21-DMA at 1.3845 could challenge the bullish commitments on the road to recovery.
GBP/USD: Additional levels to consider
Author

Dhwani Mehta
FXStreet
Residing in Mumbai (India), Dhwani is a Senior Analyst and Manager of the Asian session at FXStreet. She has over 10 years of experience in analyzing and covering the global financial markets, with specialization in Forex and commodities markets.