|

GBP/USD Price Analysis: A weekly head-and-shoulders pattern targets 1.2980 on the long-term

  • The British pound falls amid downbeat market sentiment.
  • GBP/USD could be downward-pressured by a weekly head-and-shoulders pattern.
  • GBP/USD: The weekly and the daily chart support the downward bias.

The GBP/USD is trading at 1.3464, down 0.02% as the Asian session begins. The market sentiment is downbeat. Asian futures look tilted to the downside, except for the Hang-Seng and the Nikkei 225, gaining between 0.32% and 0.03%, respectively.

GBP/USD Price Forecast: Technical outlook
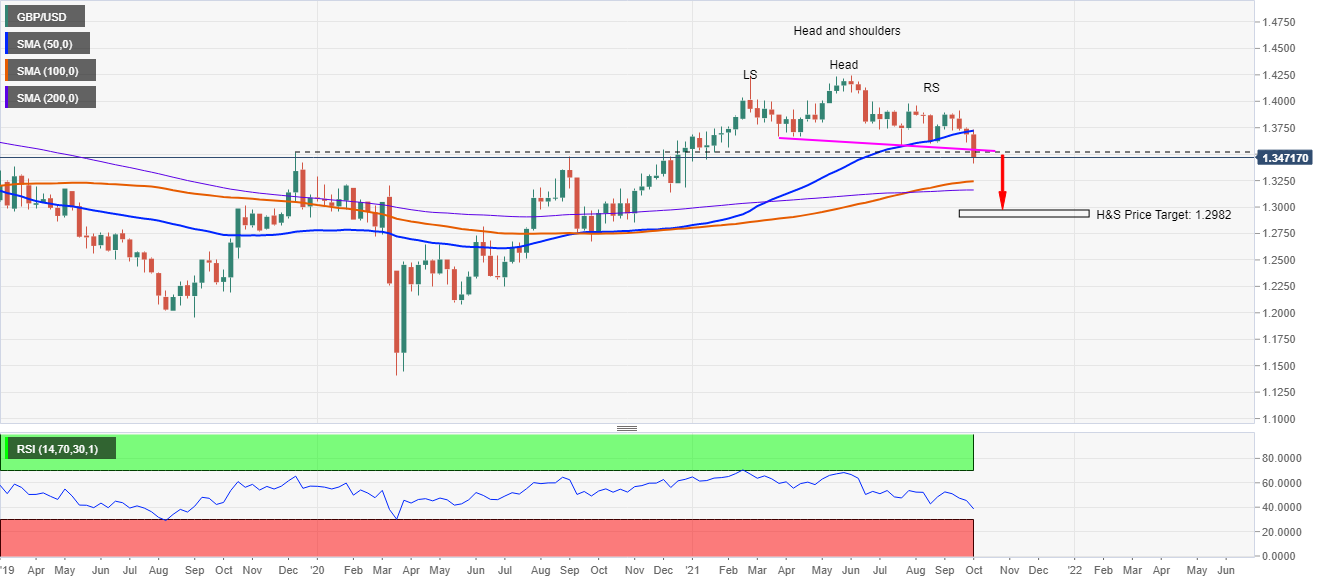
Weekly chart 

The chart depicts a head-and-shoulders pattern, which at press time, is trading below the neckline (pink line), around 1.3464.

The head-and-shoulders target is 1.2982. However, there are some hurdles on the way down. The first support would be the 100-week simple moving average (WSMA) around 1.3244, immediately followed by the 200-(WSMA) at 1.3161, and then the 1.2982 target.

On the flip side, in case of a break above the neckline, it could invalidate the pattern. The first supply zone on the way up would be the 50-WSMA around 1.3722.

The Relative Strength Index is at 38.60, aiming lower, supporting the downward bias.
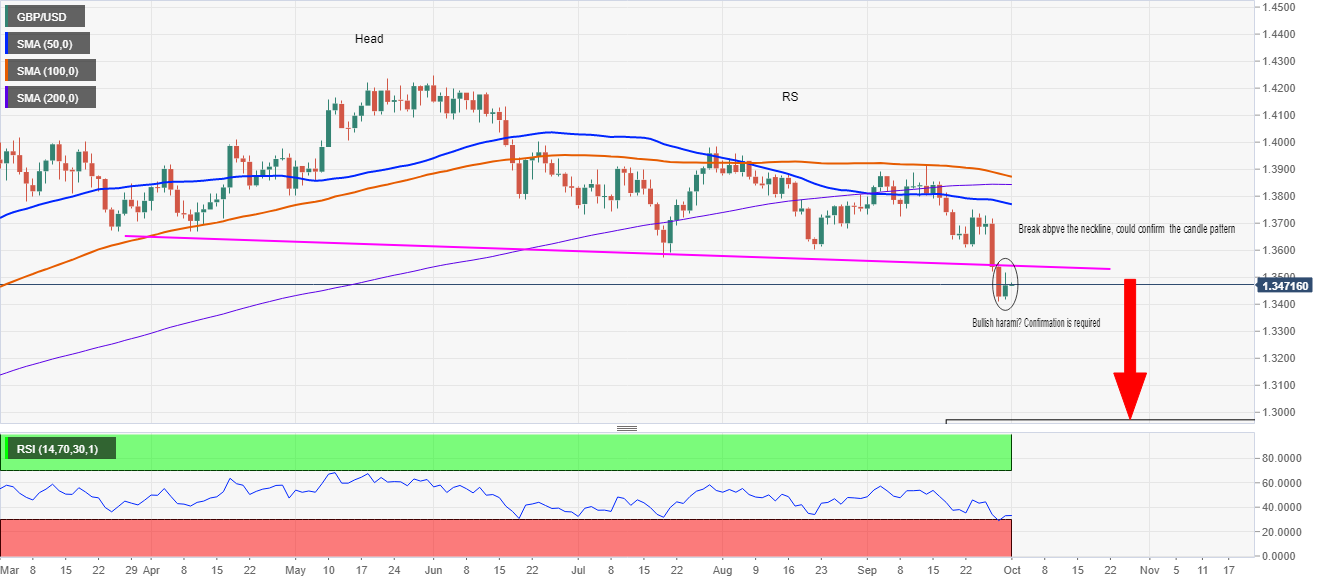
Daily chart

Cable tested the neckline of the weekly head-and-shoulders pattern around 1.3517 but retreated below 1.3500 and looks poised to consolidate as momentum indicators exit from oversold levels. The price action of the last two days formed a bullish haramI candle pattern, though a close above 1.3560 above the neckline is required to confirm its validity. In case of that outcome, then GBP/USD could be pressured to the upside. The first supply zone on its way up would be the psychological 1.3600 figure.

On the other hand, failure to break above the neckline would pressure the GBP/USD pair to the downside. The first support on its way down would be 1.3400, followed by 1.3300 and then 1.3244, the 100-week simple moving average.

The Relative Strength Index is at 33.16, slightly flat, signaling exhaustion on the downward move. The pair might consolidate before resuming the previous direction.

ADDITIONAL LEVELS TO WATCH

GBP/USD

Overview
Today last price1.3464
Today Daily Change0.0036
Today Daily Change %0.02
Today daily open1.3428
 
Trends
Daily SMA201.3741
Daily SMA501.3781
Daily SMA1001.3884
Daily SMA2001.3844
 
Levels
Previous Daily High1.3555
Previous Daily Low1.3412
Previous Weekly High1.3752
Previous Weekly Low1.361
Previous Monthly High1.3958
Previous Monthly Low1.3602
Daily Fibonacci 38.2%1.3466
Daily Fibonacci 61.8%1.35
Daily Pivot Point S11.3375
Daily Pivot Point S21.3322
Daily Pivot Point S31.3232
Daily Pivot Point R11.3518
Daily Pivot Point R21.3608
Daily Pivot Point R31.3661

Author

Christian Borjon Valencia

Christian Borjon began his career as a retail trader in 2010, mainly focused on technical analysis and strategies around it. He started as a swing trader, as he used to work in another industry unrelated to the financial markets.

More from Christian Borjon Valencia
Share:

Markets move fast. We move first.

Orange Juice Newsletter brings you expert driven insights - not headlines. Every day on your inbox.

By subscribing you agree to our Terms and conditions.

Editor's Picks

EUR/USD rebounds after falling toward 1.1700

EUR/USD gains traction and trades above 1.1730 in the American session, looking to end the week virtually unchanged. The bullish opening in Wall Street makes it difficult for the US Dollar to preserve its recovery momentum and helps the pair rebound heading into the weekend.

GBP/USD steadies below 1.3400 as traders assess BoE policy outlook

Following Thursday's volatile session, GBP/USD moves sideways below 1.3400 on Friday. Investors reassess the Bank of England's policy oıtlook after the MPC decided to cut the interest rate by 25 bps by a slim margin. Meanwhile, the improving risk mood helps the pair hold its ground.

Gold stays below $4,350, looks to post small weekly gains

Gold struggles to gather recovery momentum and stays below $4,350 in the second half of the day on Friday, as the benchmark 10-year US Treasury bond yield edges higher. Nevertheless, the precious metal remains on track to end the week with modest gains as markets gear up for the holiday season.

Crypto Today: Bitcoin, Ethereum, XRP rebound amid bearish market conditions

Bitcoin (BTC) is edging higher, trading above $88,000 at the time of writing on Monday. Altcoins, including Ethereum (ETH) and Ripple (XRP), are following in BTC’s footsteps, experiencing relief rebounds following a volatile week.

How much can one month of soft inflation change the Fed’s mind?

One month of softer inflation data is rarely enough to shift Federal Reserve policy on its own, but in a market highly sensitive to every data point, even a single reading can reshape expectations. November’s inflation report offered a welcome sign of cooling price pressures. 

XRP rebounds amid ETF inflows and declining retail demand demand

XRP rebounds as bulls target a short-term breakout above $2.00 on Friday. XRP ETFs record the highest inflow since December 8, signaling growing institutional appetite.