GBP/USD marches towards 1.2030 amid upbeat technical details, Brexit, BoE’s Bailey eyed
- GBP/USD renews attempt to cross the 50-DMA hurdle amid bullish RSI divergence, sustained trading beyond the key technical support.
- Convergence of 200-DMA, ascending trend line from late November 2022 appears a tough nut to crack for bears.
- Doubts over Brexit deal’s acceptability, mixed US data probe cable bulls amid hawkish Fed concerns.

GBP/USD picks up bids to reverse the previous day’s pullback from the 50-DMA, around 1.2035 during the initial hours of Wednesday’s Asian session. The Cable pair rose to the highest levels in a week earlier on Tuesday before reversing from 1.2143 as optimism surrounding the Brexit deal and the pair’s strength from softer US data faded as the key March month begins.
Although UK PM Rishi Sunak has already signaled that he will move forward without the Democratic Unionist Party’s (DUP) support for Brexit deal, if they turn down his efforts, the fears of witnessing political drag on the key success weighed on the GBP/USD prices on Tuesday. “The framework is what we have agreed with the European Union”, said UK’s Sunak during the BBC interview when asked whether he would impose the new deal without the backing of Northern Ireland's DUP.
Apart from Sunak’s optimism, softer US data and month-end consolidation also initially helped the Cable pair. Among the key US statistics, the US Conference Board’s (CB) Consumer Confidence dropped for the second consecutive month to 102.9 versus 106.0 prior (revised) while US Housing Price Index drops 0.1% in December versus -0.6% market forecasts and -0.1% prior. On the same line, the S&P/Case-Shiller Home Price Indices grew 4.6% YoY during the said month compared to 6.1% market expectations and 6.8% previous readings. Furthermore, Chicago Purchasing Managers’ Index for February eased to 43.6 from 44.3 previous readings and 45.0 market consensus. Additionally, the Richmond Fed Manufacturing Index for the said month eased below 11.0 prior and -5.0 expected to -16.
It should be noted that the softer data and month-end positioning failed to weigh on the hawkish Fed bets and recalled the GBP/USD bears late Tuesday as markets prepared for crucial March month events comprising Fed Chairman Jerome Powell’s testimony and Fed meeting.
Against this backdrop, Wall Street closed mixed and the US Treasury bond yields marked minor losses while the US Dollar Index (DXY) regained upside momentum in the last hour to end February on a firmer footing, by marking the first monthly gain in five.
Looking forward, final readings of the UK Manufacturing PMI for February will precede Bank of England (BoE) Governor Andrew Bailey’s speech to highlight today’s economic calendar for the GBP/USD pair traders.
GBP/USD technical analysis
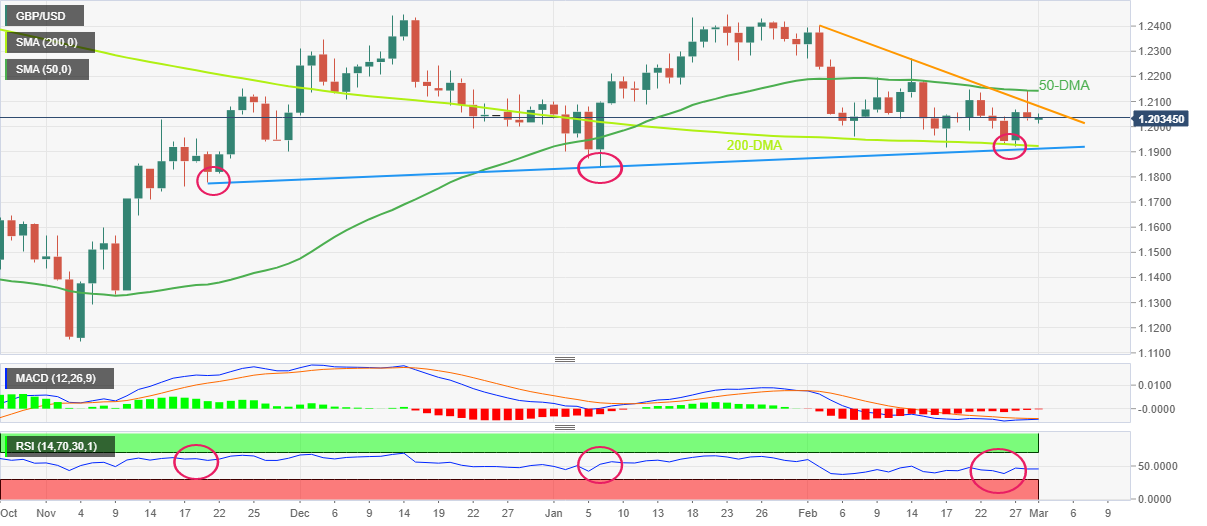
GBP/USD eyes another attempt to cross the 50-DMA hurdle during early Wednesday in Asia, following multiple failures to overcome the same since mid-February.
The Cable pair’s recovery moves take clues from the hidden bullish divergence of the RSI (14), as well as the quote’s refrain from breaking the 1.1920-25 support confluence, including the 200-DMA and ascending support line from November 21, 2022. Adding strength to the upside bias is the impending bull cross on the MACD.
That said, the GBP/USD pair’s high low of the prices and lower high of the RSI (14) line is considered a hidden bullish divergence of the oscillator and suggests the quote’s gradual run-up.
A downward-sloping resistance line from February 02, close to 1.2080 at the latest, can be considered as an immediate hurdle during the anticipated rise of the Cable pair ahead of battling with the 50-DMA level, near 1.2145 by the press time.
Following that, the two-week high of around 1.2270 could probe the GBP/USD bulls before directing them to the multiple tops marked around 1.2445-50.
Meanwhile, a convergence of the 200-DMA and a multi-day-old ascending trend line, around 1.1925-20, appears the key support to watch for the Cable pair sellers to retake control.
GBP/USD: Daily chart
Trend: Further upside expected
Author

Anil Panchal
FXStreet
Anil Panchal has nearly 15 years of experience in tracking financial markets. With a keen interest in macroeconomics, Anil aptly tracks global news/updates and stays well-informed about the global financial moves and their implications.


