GBP/JPY Technical Analysis: Descending trend channel favors a pullback
- GBP/JPY forms short-term descending trend channel on the four-hour chart during early Tuesday.
- The pattern favors the pair’s pullback moves to the 142.70 and the 141.88 supports.
- On the break of 144.15 resistance, the formation gets negated.

The GBP/JPY pair trades little changed around 143.25 during early Asian session on Tuesday. The pair portrays a short term downward sloping trend channel that favors its pullback. The channel formation came in effect after the 100-day simple moving average (SMA) confined the pair’s upside during the late-January month.
GBP/JPY 4-hour chart
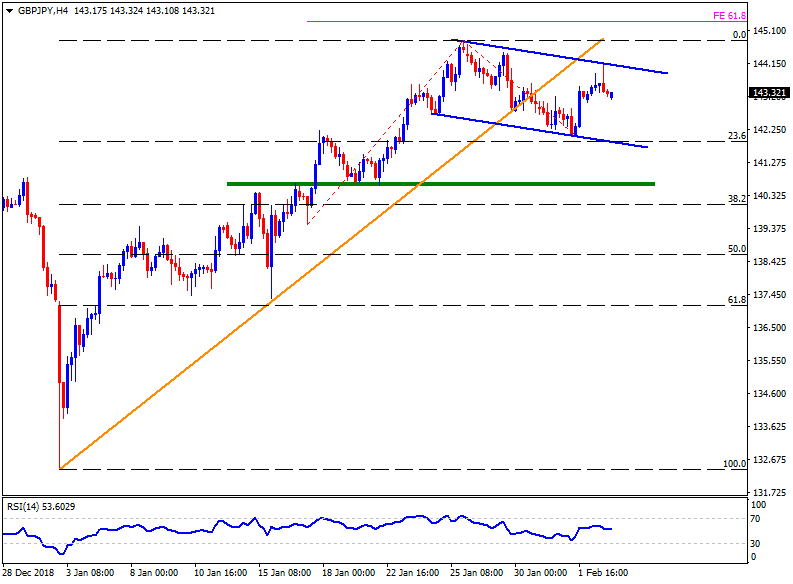
With an immediate descending trend channel, the GBP/JPY is more likely to revisit the 142.70 support prior to highlighting the 141.88 level comprising channel’s lower-line. Should the pair fails to bounce off the channel-support, the 140.70-60 horizontal-area and the 140.00 round figure may act as important rests.
In case, the prices continue trading downwards after 140.00, the 139.00 and the 137.30 could gain the bears’ attention.
Alternatively, an upside clearance of 144.15 negates the bearish chart pattern and opens the door for its recovery to 144.85. During the pair’s extended rise beyond 144.85, the 61.8% Fibonacci expansion of its latest pullback, near 145.35, could restrict further advances.
Author

Anil Panchal
FXStreet
Anil Panchal has nearly 15 years of experience in tracking financial markets. With a keen interest in macroeconomics, Anil aptly tracks global news/updates and stays well-informed about the global financial moves and their implications.


