|

GBP/JPY seeing some topside action, hurdles over 183.00

  • The GBP/JPY caught a bounce on Monday as investors go risk-on.
  • Tuesday sees UK labor and PMI data.
  • Japan has a Tokyo CPI advance inflation reading to close out the week.

The GBP/JPY has reclaimed the 183.00 handle in Monday trading as broad-market risk flows turn risk-on, taking safe havens like the Japanese Yen (JPY) down and bolstering the relatively riskier Pound Sterling (GBP) into fresh highs.

The Guppy is trading into its highest bids in over a week, landing just north of the 183.00 handle at 183.28 before a relief pullback drags the pair back down.

The GBP will need all the help it can get this week: with a sedate Monday on the cards, Tuesday is set to kick things off with a bang. 

On the docket this week: UK labor, UK PMIs, Tokyo CPI

Early Tuesday at 06:00 GMT sees UK Claimant Count Change and Employment Change numbers; markets expect the UK to see an uptick in people seeking jobless benefits to increase from 0.9K to 2.3K, while the number of employed people is expected to decline 198K, an improvement over the previous reading of -207K, but still in negative territory.

UK Purchasing Manager Index (PMI) figures are also on the docket for Tuesday at 08:30 GMT; both services and manufacturing components are expected to improve slightly, with the composite PMI for October expected to rise from 48.5 to 48.8.

On the Yen side, Japan's next round of inflation figures are due late Thursday at 23:30 GMT. The Core Tokyo Consumer Price Index (CPI) last showed an annualized 2.5% increase, and markets are forecasting that the CPI (minus volatile fresh food prices) will hold steady at that number, printing 2.5% for the year into October.

GBP/JPY Technical Outlook

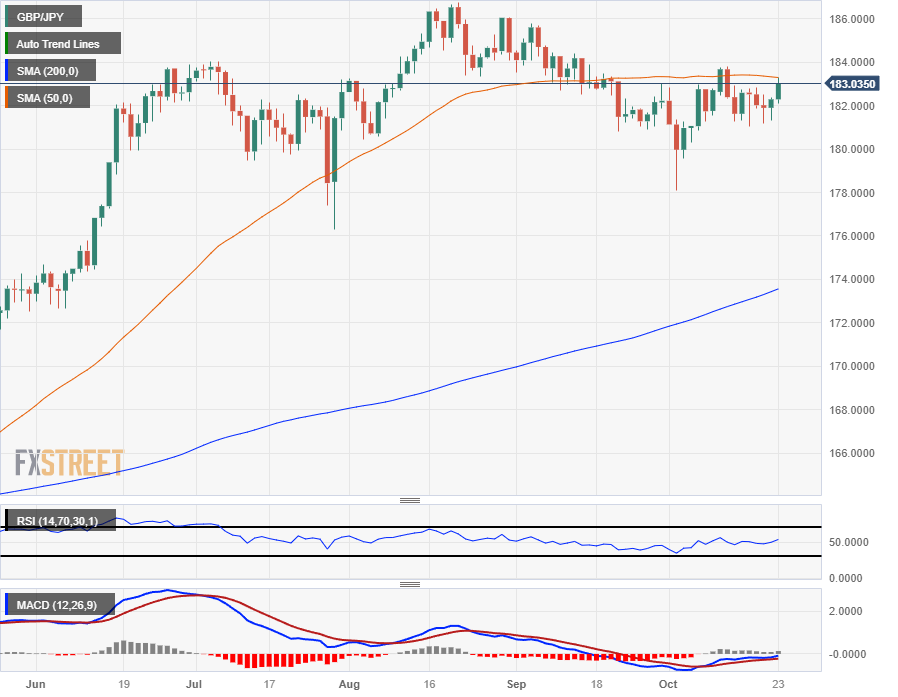
The GBP/JPY is getting dragged back into the 50-day Simple Moving Average (SMA) on daily candlesticks as Monday's six-day high pins the Guppy into medium-term averages.

The next topside level to beat will be the last swing high 183.82 before bidders can re-challenge multi-year highs set back in August beyond the 186.00 handle.

The floor is priced in at the very low end of early October's unexpected plunge into 178.00, and the long-term outlook has the GBP/JPY firmly buried in the high end with the 200-day SMA leaning bullish, but far below current price action just beneath 174.00.

GBP/JPY Daily Chart

GBP/JPY Technical Levels

GBP/JPY

Overview
Today last price183.04
Today Daily Change0.75
Today Daily Change %0.41
Today daily open182.29
 
Trends
Daily SMA20181.92
Daily SMA50183.33
Daily SMA100182.09
Daily SMA200173.44
 
Levels
Previous Daily High182.38
Previous Daily Low181.3
Previous Weekly High182.81
Previous Weekly Low181.02
Previous Monthly High185.78
Previous Monthly Low180.82
Daily Fibonacci 38.2%181.96
Daily Fibonacci 61.8%181.71
Daily Pivot Point S1181.6
Daily Pivot Point S2180.91
Daily Pivot Point S3180.53
Daily Pivot Point R1182.68
Daily Pivot Point R2183.06
Daily Pivot Point R3183.75

Author

Joshua Gibson

Joshua joins the FXStreet team as an Economics and Finance double major from Vancouver Island University with twelve years' experience as an independent trader focusing on technical analysis.

More from Joshua Gibson
Share:

Markets move fast. We move first.

Orange Juice Newsletter brings you expert driven insights - not headlines. Every day on your inbox.

By subscribing you agree to our Terms and conditions.

Editor's Picks

EUR/USD: Bulls pray for a dovish Fed

EUR/USD has finally taken a breather after a pretty energetic climb. The pair broke above 1.1680 in the second half of the week, reaching its highest levels in around two months before running into some selling pressure. Even so, it has gained almost two cents from the late-November dip just below 1.1500 the figure.

GBP/USD trims gains, recedes toward 1.3320

GBP/USD is struggling to keep its daily advance, coming under fresh pressure and retreating to the 1.3320 zone following a mild bullish attempt in the Greenback. Even though US consumer sentiment surprised to the upside, the US Dollar isn’t getting much love, as traders are far more interested in what the Fed will say next week.

Gold: Bullish momentum fades despite broad USD weakness

After rising more than 3.5% in the previous week, Gold has entered a consolidation phase and fluctuated at around $4,200. The Federal Reserve’s interest rate decision and revised Summary of Economic Projections, also known as the dot plot, could trigger the next directional move in XAU/USD. 

Week ahead: Rate cut or market shock? The Fed decides

Fed rate cut widely expected; dot plot and overall meeting rhetoric also matter. Risk appetite is supported by Fed rate cut expectations; cryptos show signs of life. RBA, BoC and SNB also meet; chances of surprises are relatively low. Dollar weakness could linger; both the aussie and the yen best positioned to gain further. Gold and oil eye Ukraine-Russia developments; a peace deal remains elusive.

Week ahead – Rate cut or market shock? The Fed decides

Fed rate cut widely expected; dot plot and overall meeting rhetoric also matter. Risk appetite is supported by Fed rate cut expectations; cryptos show signs of life. RBA, BoC and SNB also meet; chances of surprises are relatively low.

Ripple faces persistent bear risks, shrugging off ETF inflows

Ripple is extending its decline for the second consecutive day, trading at $2.06 at the time of writing on Friday. Sentiment surrounding the cross-border remittance token continues to lag despite steady inflows into XRP spot ETFs.