|

GBP/JPY Price Prediction: Testing trendline as it continues sinking

  • GBP/JPY has fallen to a trendline for the August rally. 
  • The pair is in a downtrend with odds favoring an extension lower. 

GBP/JPY is trying to pierce the trendline for the uptrend since the August lows. If it is successful and decisively breaches the trendline, it will suggest a follow-through lower to a fresh downside target at 186.20, the 61.8% Fibonacci of the down move prior to the trendline (blue rectangle on chart). 

The pair is now in a short and probably medium-term downtrend (since the October 31 high) and according to technical analysis lore trends have a tendency to extend, suggesting the odds favor even more downside to come.

GBP/JPY Daily Chart 

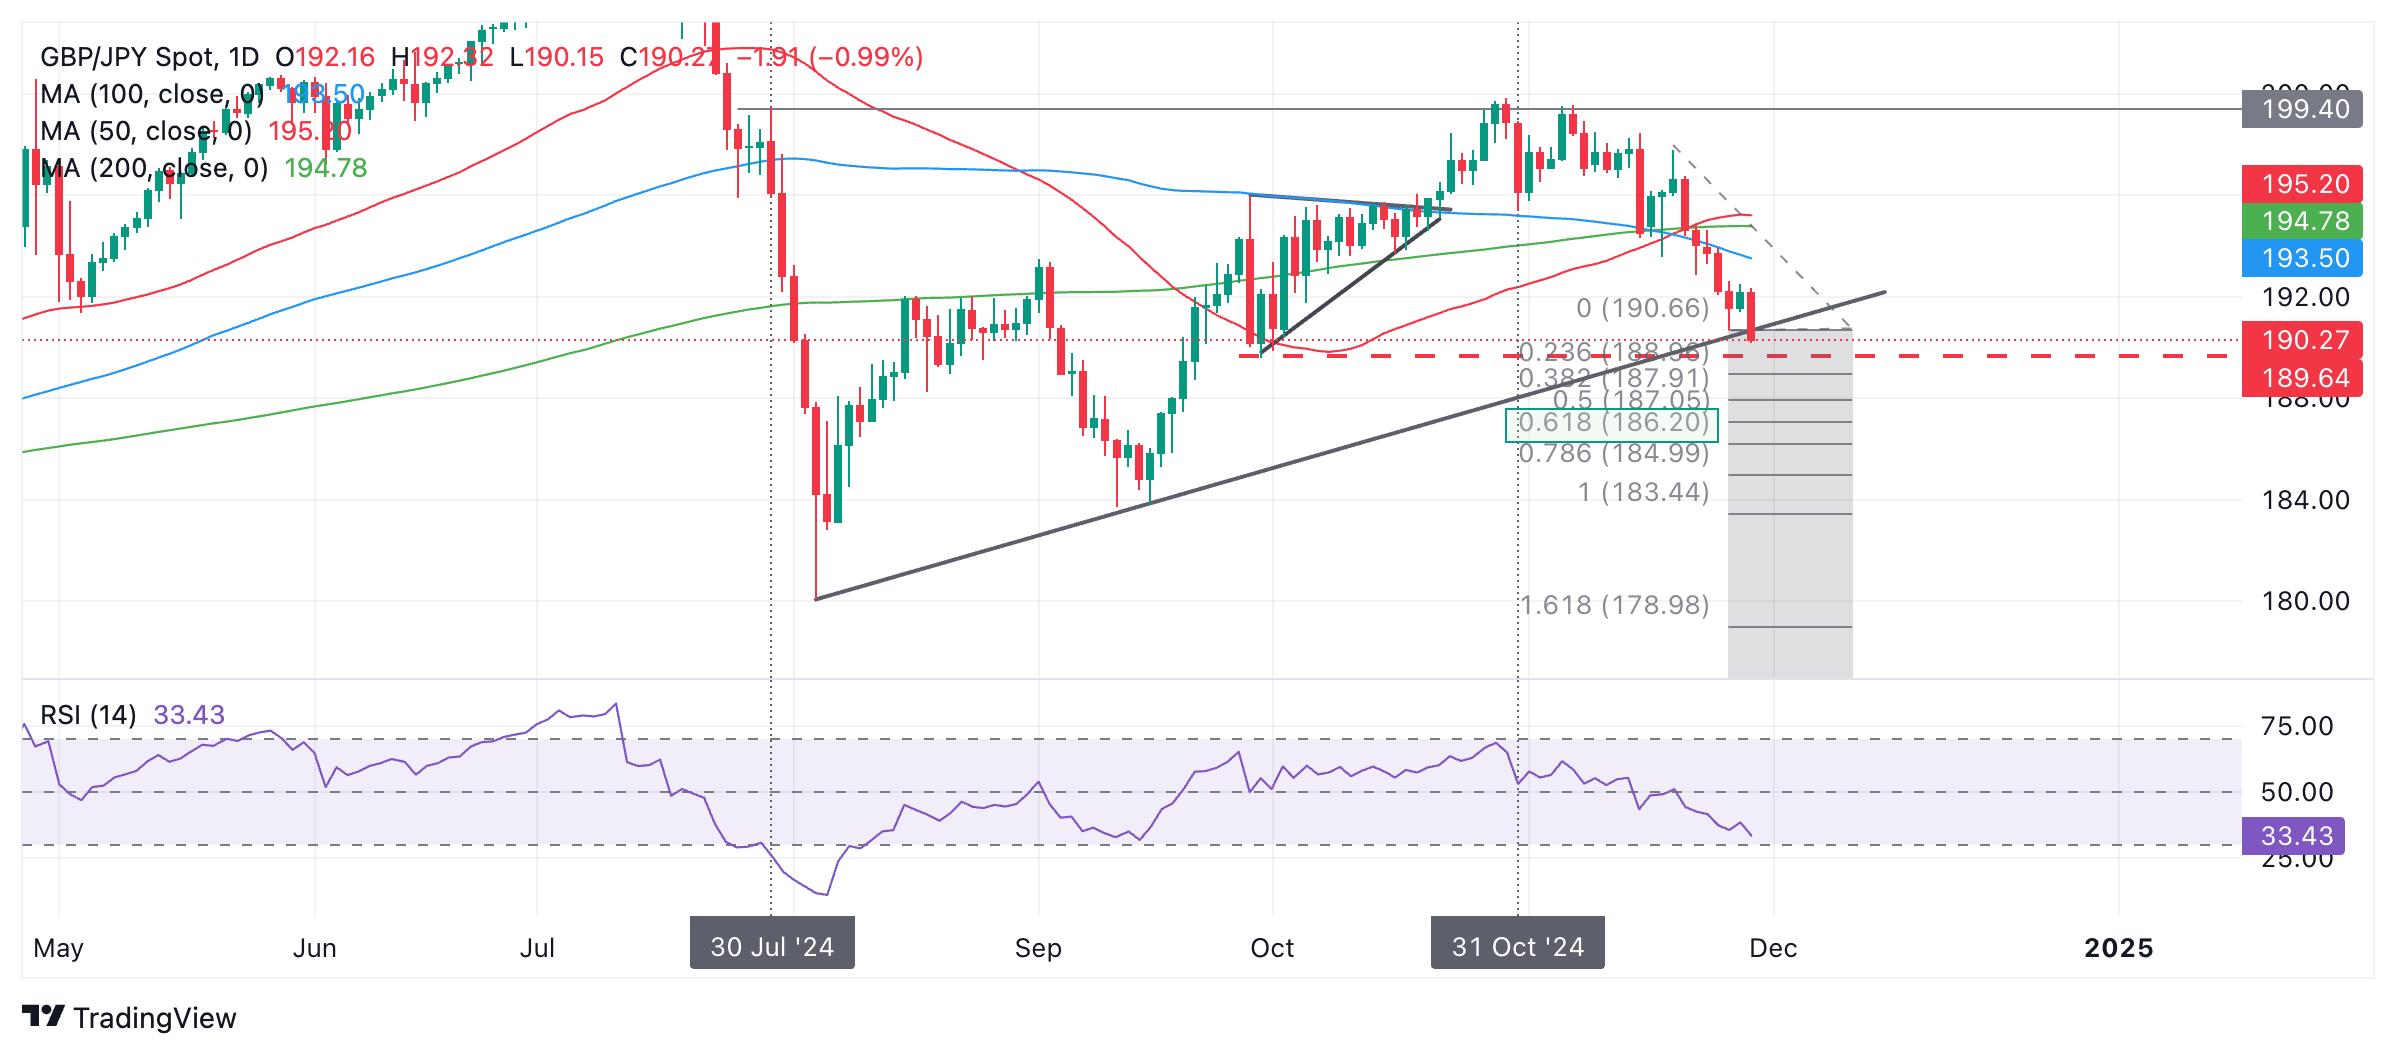
GBP/JPY is making its way down to the next target for the pair at around 189.56, the low of the Right-Angled triangle that formed in late September and early October. 

It is also possible it could bounce from the current level at the trendline which is a support level.

The Relative Strength Index (RSI) is not yet oversold which indicates the pair could still have further to fall before it gets oversold.  

A decisive breach of the trendline would be one accompanied by a long red candlestick that closed near its lows and well clear of the trendline, or three consecutive red candles that breached the level.

Author

Joaquin Monfort

Joaquin Monfort is a financial writer and analyst with over 10 years experience writing about financial markets and alt data. He holds a degree in Anthropology from London University and a Diploma in Technical analysis.

More from Joaquin Monfort
Share:

Editor's Picks

EUR/USD treads water above 1.1850 amid thin trading

EUR/USD stays defensive but holds 1.1850 amid quiet markets in the European hours on Monday.  The US Dollar is struggling for direction due to thin liquidity conditions as US markets are closed in observance of Presidents' Day. 

GBP/USD flat lines as traders await key UK and US macro data

GBP/USD kicks off a new week on a subdued note and oscillates in a narrow range near 1.365 in Monday's European trading. The mixed fundamental backdrop warrants some caution for aggressive traders as the market focus now shifts to this week's important releases from the UK and the US.

Gold slides below $5,000 amid USD uptick and positive risk tone; downside seems limited

Gold attracts fresh sellers at the start of a new week and reverses a part of Friday's strong move up of over $150 from sub-$4,900 levels. The commodity slides back below the $5,000 psychological mark during the Asian session, though the downside potential seems limited amid a combination of supporting factors.

Bitcoin, Ethereum and Ripple consolidate within key ranges as selling pressure eases

Bitcoin and Ethereum prices have been trading sideways within key ranges following the massive correction. Meanwhile, XRP recovers slightly, breaking above the key resistance zone. The top three cryptocurrencies hint at a potential short-term recovery, with momentum indicators showing fading bearish signs.

Global inflation watch: Signs of cooling services inflation

Realized inflation landed close to expectations in January, as negative base effects weighed on the annual rates. Remaining sticky inflation is largely explained by services, while tariff-driven goods inflation remains limited even in the US.

Ripple Price Forecast: XRP potential bottom could be in sight

Ripple edges up above the intraday low of $1.35 at the time of writing on Friday amid mixed price actions across the crypto market. The remittance token failed to hold support at $1.40 the previous day, reflecting risk-off sentiment amid a decline in retail and institutional sentiment.