GBP/JPY Price Forecast: Sinks nearly 200 pips, tests 202.00
- GBP/JPY plunges 0.97% to 201.94, marking steepest daily fall in over a week.
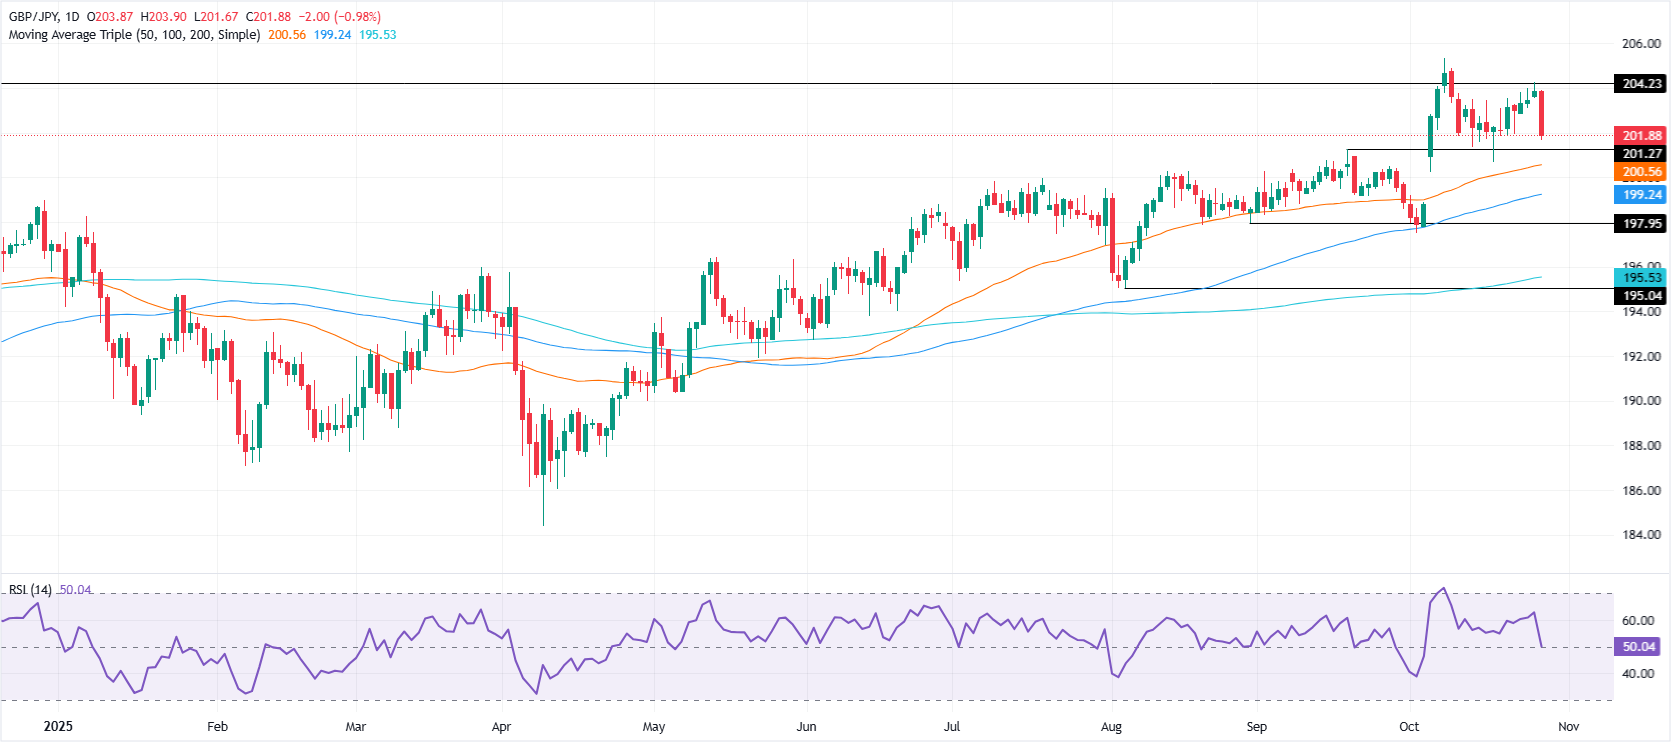
- Break below 20-day SMA at 202.43 opens path toward 201.27 and 200.63 supports.
- Recovery above 202.00 may spark rebound to 203.00 and 204.24 resistance zones.

The GBP/JPY plunged sharply on Tuesday, close to 200 pips or 0.97% as the cross-pair slides below the 202.00 milestone, for the first time since last Friday. At the time of writing, the pair trades at 201.94 virtually unchanged, as Wednesday’s Asian session begins.
GBP/JPY Price Forecast: Technical outlook
The GBP/JPY technical picture shows that the uptrend remains in place, but the pair could test lower prices after it cleared the 20-day SMA at 202.43. A further extension lower looms if the cross clear September’s 18 high at 201.27, opening the door for further downside.
The next key support levels are the 50-day SMA at 200.63, followed by the 100-day SMA at 199.29 and October’s low at 197.49.
Conversely, if GBP/JPY reclaims 202.00, buyers could drive price action towards the 203.00 milestone, followed by the current week’s high at 204.24.
GBP/JPY Price Chart – Daily
Pound Sterling Price This week
The table below shows the percentage change of British Pound (GBP) against listed major currencies this week. British Pound was the strongest against the US Dollar.
| USD | EUR | GBP | JPY | CAD | AUD | NZD | CHF | |
|---|---|---|---|---|---|---|---|---|
| USD | -0.13% | 0.38% | -0.55% | -0.45% | -0.64% | -0.04% | -0.39% | |
| EUR | 0.13% | 0.53% | -0.35% | -0.32% | -0.41% | 0.09% | -0.26% | |
| GBP | -0.38% | -0.53% | -0.99% | -0.84% | -0.95% | -0.43% | -0.82% | |
| JPY | 0.55% | 0.35% | 0.99% | 0.02% | -0.17% | 0.40% | 0.07% | |
| CAD | 0.45% | 0.32% | 0.84% | -0.02% | -0.24% | 0.41% | 0.02% | |
| AUD | 0.64% | 0.41% | 0.95% | 0.17% | 0.24% | 0.52% | 0.13% | |
| NZD | 0.04% | -0.09% | 0.43% | -0.40% | -0.41% | -0.52% | -0.39% | |
| CHF | 0.39% | 0.26% | 0.82% | -0.07% | -0.02% | -0.13% | 0.39% |
The heat map shows percentage changes of major currencies against each other. The base currency is picked from the left column, while the quote currency is picked from the top row. For example, if you pick the British Pound from the left column and move along the horizontal line to the US Dollar, the percentage change displayed in the box will represent GBP (base)/USD (quote).
Author

Christian Borjon Valencia
FXStreet
Markets analyst, news editor, and trading instructor with over 14 years of experience across FX, commodities, US equity indices, and global macro markets.


