GBP/JPY Price Forecast: Refreshes daily peak, around 198.80 after UK PMIs
- GBP/JPY attracts fresh buyers and reverses a part of Wednesday’s slide to a two-week low.
- The intraday positive momentum picks up pace following the release of the UK PMI prints.
- The mixed technical setup warrants some caution before positioning for any further gains.

The GBP/JPY cross regains positive traction on Thursday and moves away from a nearly two-week low, around the 197.85 area touched the previous day. The momentum picks up pace during the first half of the European session following the release of UK PMIs and lifts spot prices to a fresh daily peak, around the 198.75-198.80 region in the last hour.
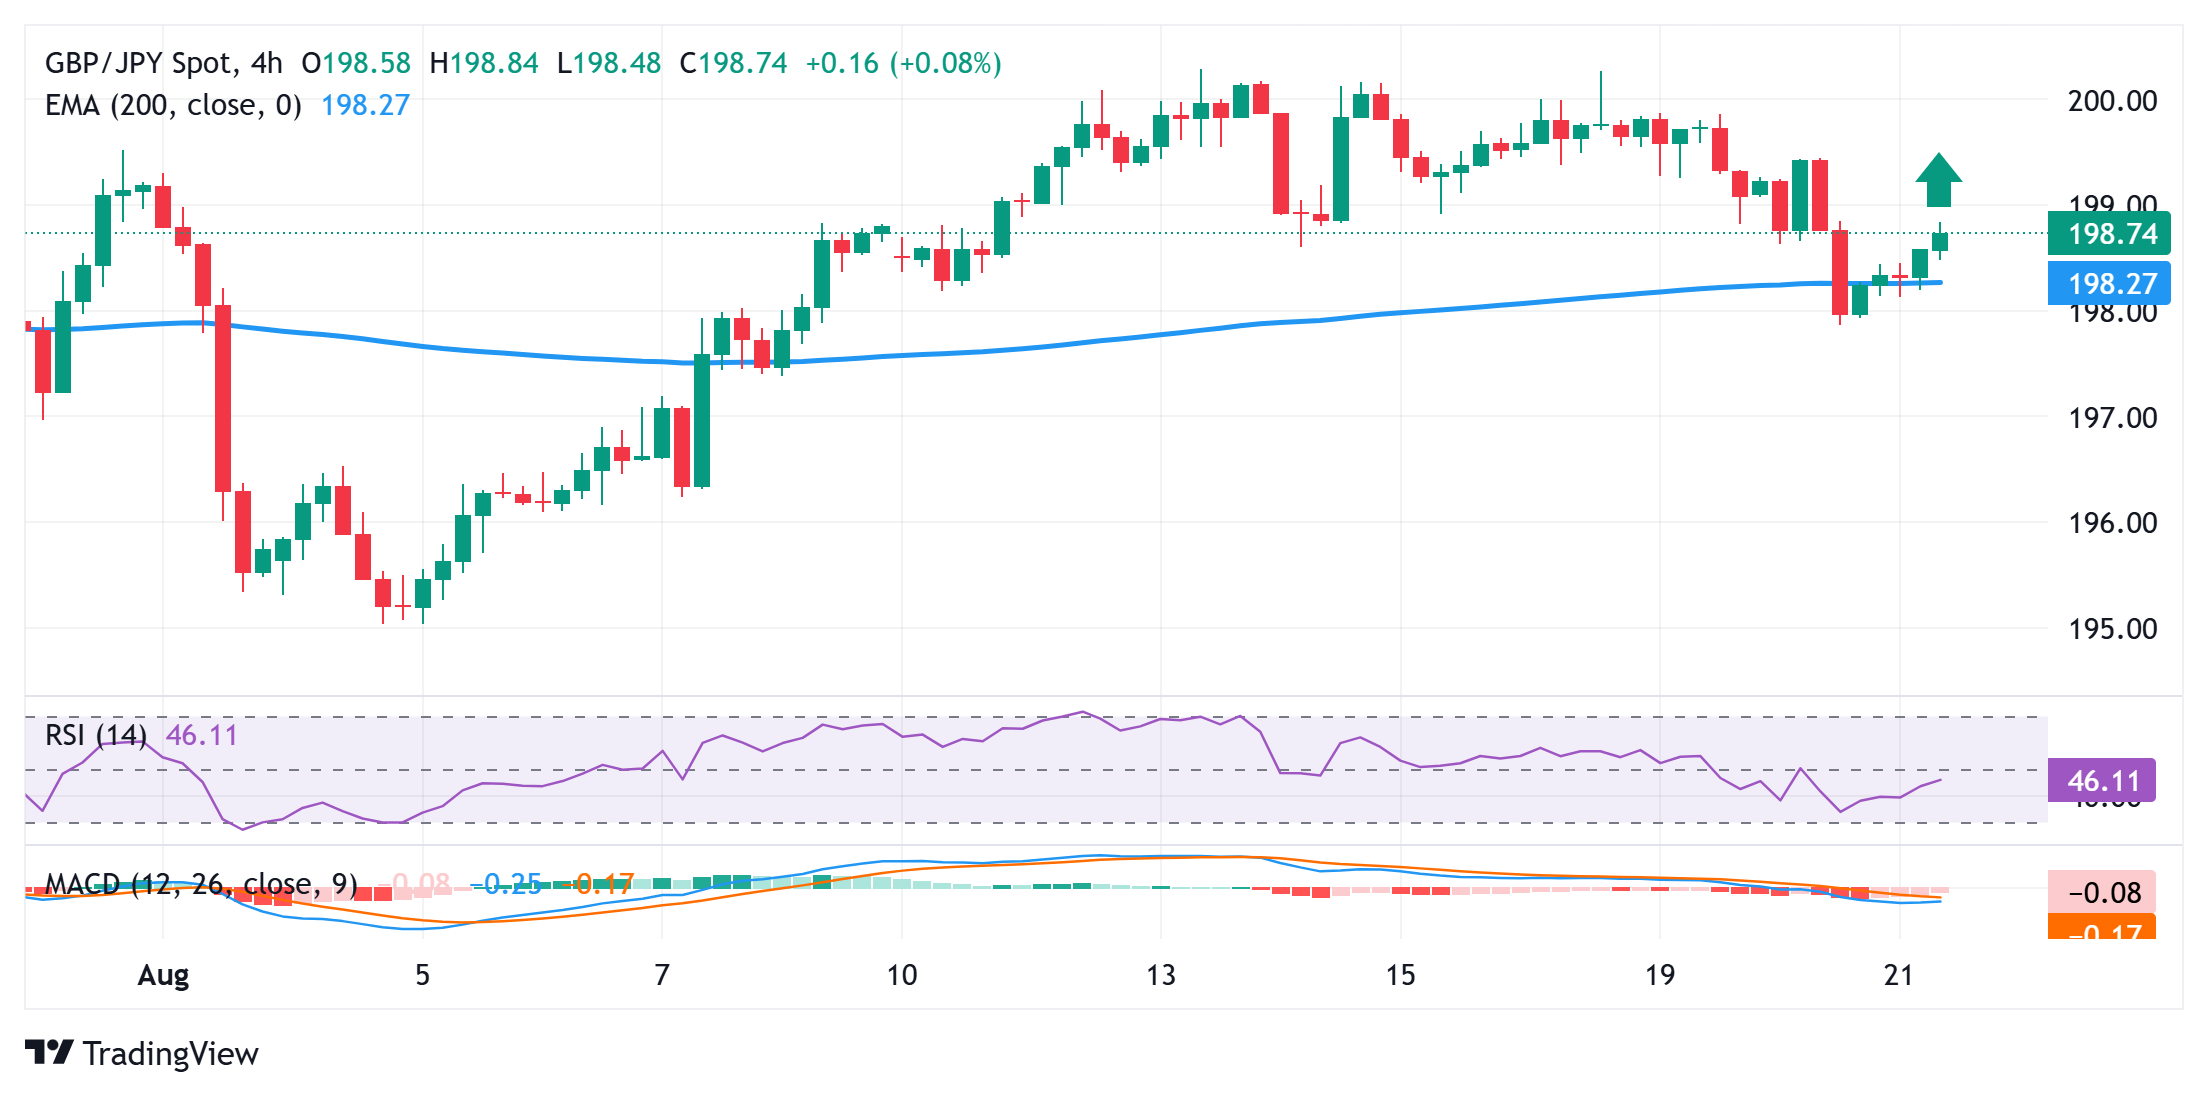
From a technical perspective, the GBP/JPY cross showed resilience below the 200-day Exponential Moving Average (EMA) on Wednesday. The subsequent move up suggests that this week's corrective pullback from levels beyond the 200.00 psychological mark, or the highest level since July 2024, might have run its course and backs the case for a further appreciating move.
However, mixed oscillators on the daily/4-hour charts warrant caution. Hence, any further move up could face some resistance near the 199.00 round figure ahead of the 199.25 region. Some follow-through buying will reaffirm the positive outlook and lift the GBP/JPY cross beyond mid-199.00s, towards the 200 mark en route to the year-to-date peak, around the 200.25 region.
On the flip side, the 198.20-198.15 region, or the 200-day EMA, could act as an immediate support. Acceptance below the said support, leading to a subsequent break through the overnight swing low, around the 197.85 region, might shift the bias in favor of bearish traders. The GBP/JPY cross might then weaken further towards the 197.35 area en route to the 197.00 mark.
GBP/JPY 4-hour chart
Economic Indicator
S&P Global Composite PMI
The Composite Purchasing Managers Index (PMI), released on a monthly basis by S&P Global, is a leading indicator gauging private-business activity in UK for both the manufacturing and services sectors. The data is derived from surveys to senior executives. Each response is weighted according to the size of the company and its contribution to total manufacturing or services output accounted for by the sub-sector to which that company belongs. Survey responses reflect the change, if any, in the current month compared to the previous month and can anticipate changing trends in official data series such as Gross Domestic Product (GDP), industrial production, employment and inflation.The index varies between 0 and 100, with levels of 50.0 signaling no change over the previous month. A reading above 50 indicates that the UK private economy is generally expanding, a bullish sign for the Pound Sterling (GBP). Meanwhile, a reading below 50 signals that activity is generally declining, which is seen as bearish for GBP.
Read more.Last release: Thu Aug 21, 2025 08:30 (Prel)
Frequency: Monthly
Actual: 53
Consensus: 51.6
Previous: 51.5
Source: S&P Global
Author

Haresh Menghani
FXStreet
Haresh Menghani is a detail-oriented professional with 10+ years of extensive experience in analysing the global financial markets.


