GBP/JPY Price Forecast: Giving signs of topping below 200.00
- The Pound is under growing pressure against the Yen, amid risk-off markets and a hawkish BoJ.
- The Recent lower highs and a potential double top suggest that the pair might have hit a top at 200.20.
- GBP/JPY is forming a triangle pattern.

The British Pound is showing signs of topping after having reached one-year highs, right above the 200.00 round level against the Japanese Yen. Technical indicators turning lower and a succession of lower highs in the last few days are giving fresh hope for bears.
The fundamental background is also Yen-supportive. A risk-averse mod on Tuesday amid the war between Trump and the Federal Reserve is supporting the safe-haven Yen, already buoyed by the hawkish comments by BoJ Governour Ueda at the Jackson Hole meeting last week.
GBP/JPY is forming a triangle pattern below 200.20
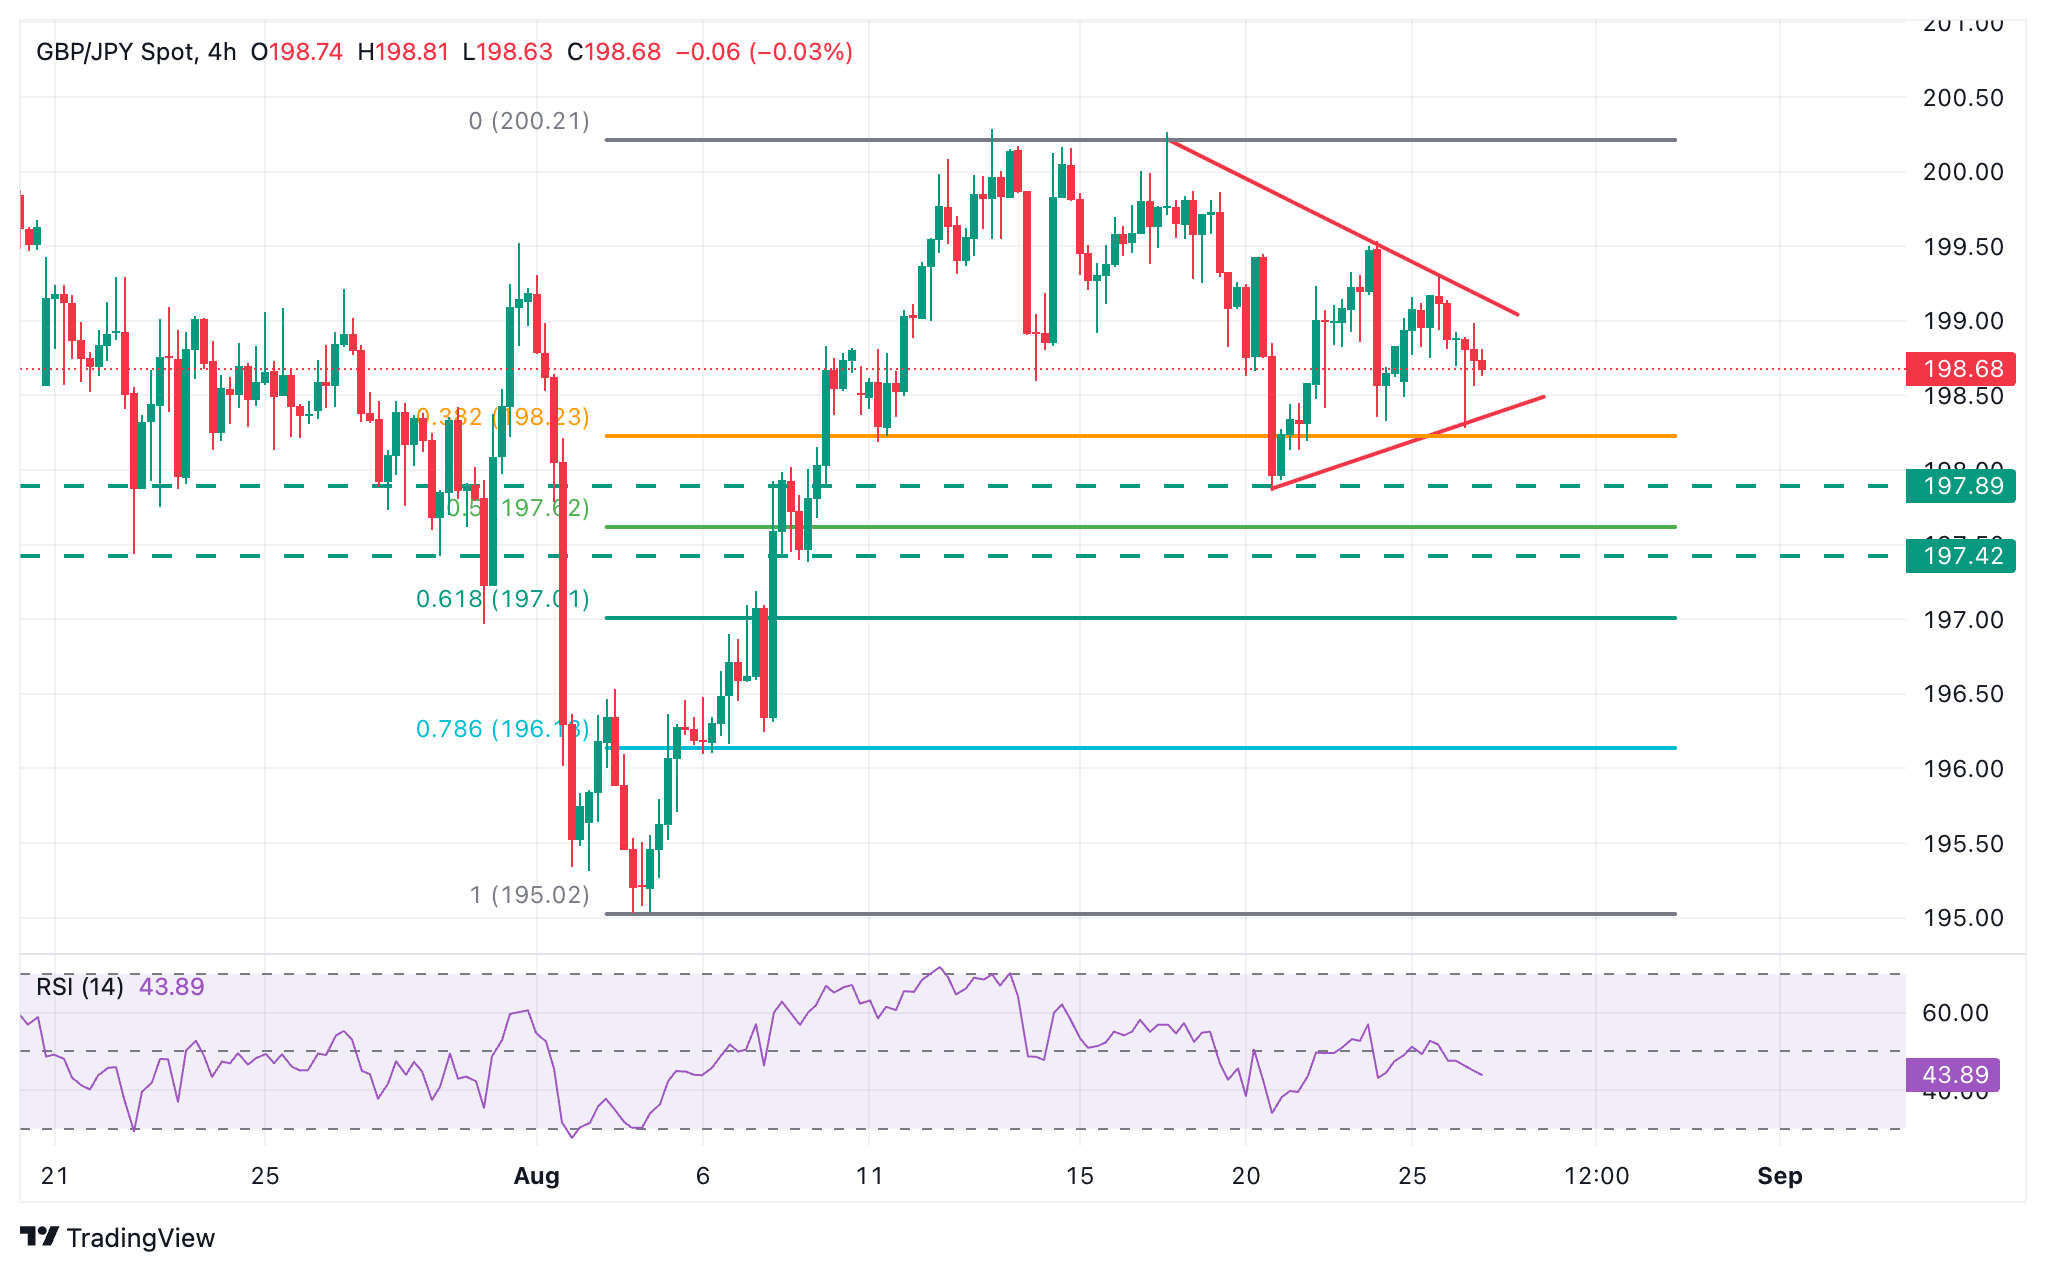
Price action has been showing a sequence of higher highs and higher lows over the last week, forming a triangle pattern. This is often a continuation figure, but the weakening momentum and a potential double top at the mentioned 200.20 level suggest the possibility of a deeper correction.
Immediate support is at the triangle's bottom, at 198.35, broadly coincident with the August 22 low. Further down, the targets are the August 20 low, at 197.85, and the intra-day level, at 197.40.
To the upside, the pair should break the triangle top, at 199.10, and the August 22 high, at the 199.50 area, to ease bearish pressure and shift the focus towards the 200.00-200.20 resistance area.
Japanese Yen Price Today
The table below shows the percentage change of Japanese Yen (JPY) against listed major currencies today. Japanese Yen was the strongest against the New Zealand Dollar.
| USD | EUR | GBP | JPY | CAD | AUD | NZD | CHF | |
|---|---|---|---|---|---|---|---|---|
| USD | 0.02% | -0.10% | -0.27% | -0.01% | 0.03% | 0.11% | 0.20% | |
| EUR | -0.02% | -0.05% | -0.17% | -0.02% | 0.06% | 0.33% | 0.21% | |
| GBP | 0.10% | 0.05% | -0.12% | 0.05% | 0.16% | 0.38% | 0.25% | |
| JPY | 0.27% | 0.17% | 0.12% | 0.18% | 0.17% | 0.53% | 0.25% | |
| CAD | 0.00% | 0.02% | -0.05% | -0.18% | 0.05% | 0.33% | 0.07% | |
| AUD | -0.03% | -0.06% | -0.16% | -0.17% | -0.05% | 0.08% | 0.00% | |
| NZD | -0.11% | -0.33% | -0.38% | -0.53% | -0.33% | -0.08% | -0.12% | |
| CHF | -0.20% | -0.21% | -0.25% | -0.25% | -0.07% | 0.00% | 0.12% |
The heat map shows percentage changes of major currencies against each other. The base currency is picked from the left column, while the quote currency is picked from the top row. For example, if you pick the Japanese Yen from the left column and move along the horizontal line to the US Dollar, the percentage change displayed in the box will represent JPY (base)/USD (quote).
Author

Guillermo Alcala
FXStreet
Graduated in Communication Sciences at the Universidad del Pais Vasco and Universiteit van Amsterdam, Guillermo has been working as financial news editor and copywriter in diverse Forex-related firms, like FXStreet and Kantox.


