GBP/JPY Price Forecast: Double top near 215.00 weakens near-term outlook
- GBP/JPY edges lower as intervention speculation supports the Japanese Yen.
- Price remains range-bound with the 21-day and 50-day SMAs acting as near-term technical pivots.
- Momentum indicators point to a cooling bullish bias.

The British Pound (GBP) is trading on the back foot against the Japanese Yen (JPY) on Wednesday, with GBP/JPY under modest pressure as demand for the Yen picks up amid fresh intervention speculation.
At the time of writing, the cross is trading around 210.37, as a quiet economic data calendar in both Japan and the UK keeps price action capped inside this week’s narrow trading range.
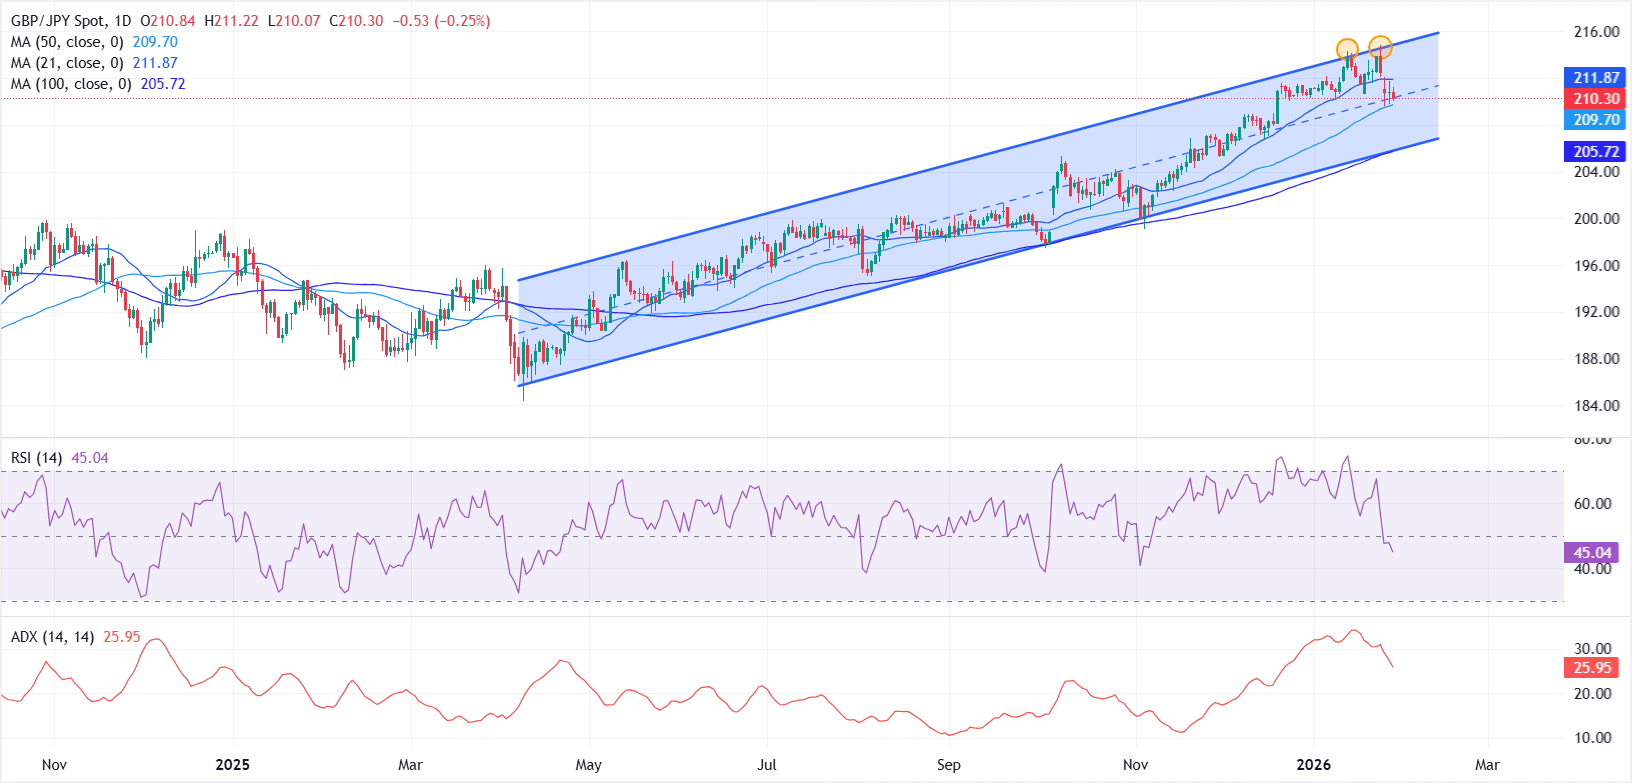
From a technical perspective, GBP/JPY continues to trade within a well-defined ascending parallel channel, with the broader bullish structure underpinned by a clear sequence of higher highs and higher lows.
However, the near-term outlook has turned slightly bearish after the pair carved out a double-top chart pattern in the 214.00-215.00 region near the upper boundary of the channel.
Momentum indicators reflect this cooling bias. The Relative Strength Index (RSI) has slipped to around 45.7 after retreating from overbought territory, suggesting bullish momentum is fading. At the same time, the Average Directional Index (ADX) has eased to near 25.9, pointing to a loss of trend strength.
On the downside, price action is currently stabilizing above the 50-day Simple Moving Average (SMA) near 209.70. A sustained break below this level would expose the 100-day SMA around 205.70, which closely aligns with the lower boundary of the rising channel.
A decisive daily close below the channel would signal a deeper corrective phase, potentially opening the door toward the 200.00 psychological handle.
On the upside, the 21-day SMA near 211.80 is capping immediate recovery attempts. Failure to reclaim this zone would keep near-term risks tilted to the downside.
Conversely, a clear break above it could attract fresh buying interest, allowing a retest of the double-top region near the channel top, with scope for an extension to new highs if bullish momentum re-accelerates.
Japanese Yen FAQs
The Japanese Yen (JPY) is one of the world’s most traded currencies. Its value is broadly determined by the performance of the Japanese economy, but more specifically by the Bank of Japan’s policy, the differential between Japanese and US bond yields, or risk sentiment among traders, among other factors.
One of the Bank of Japan’s mandates is currency control, so its moves are key for the Yen. The BoJ has directly intervened in currency markets sometimes, generally to lower the value of the Yen, although it refrains from doing it often due to political concerns of its main trading partners. The BoJ ultra-loose monetary policy between 2013 and 2024 caused the Yen to depreciate against its main currency peers due to an increasing policy divergence between the Bank of Japan and other main central banks. More recently, the gradually unwinding of this ultra-loose policy has given some support to the Yen.
Over the last decade, the BoJ’s stance of sticking to ultra-loose monetary policy has led to a widening policy divergence with other central banks, particularly with the US Federal Reserve. This supported a widening of the differential between the 10-year US and Japanese bonds, which favored the US Dollar against the Japanese Yen. The BoJ decision in 2024 to gradually abandon the ultra-loose policy, coupled with interest-rate cuts in other major central banks, is narrowing this differential.
The Japanese Yen is often seen as a safe-haven investment. This means that in times of market stress, investors are more likely to put their money in the Japanese currency due to its supposed reliability and stability. Turbulent times are likely to strengthen the Yen’s value against other currencies seen as more risky to invest in.
Author

Vishal Chaturvedi
FXStreet
I am a macro-focused research analyst with over four years of experience covering forex and commodities market. I enjoy breaking down complex economic trends and turning them into clear, actionable insights that help traders stay ahead of the curve.














