GBP/JPY Price Forecast: Bulls in control, hit fresh YTD high above 205.00
- GBP/JPY hits six-week and yearly high as broad Yen weakness lifts the pair.
- Bullish structure intact with higher highs and lows; RSI points upward, supporting further gains.
- Resistance near recent highs, while drop below 205.00 could trigger correction toward lower support levels.

The GBP/JPY rallies to a fresh six-week and yearly high above the 205.00 figure, posts gain of over 0.40% or 80 pips as the Bank of Japan Governor Kazuo Ueda met with the Japanese Finance Minister. The cross-pair trades at 205.07 virtually unchanged as Thursday’s Asian session gets underway.
GBP/JPY Price Forecast: Technical outlook
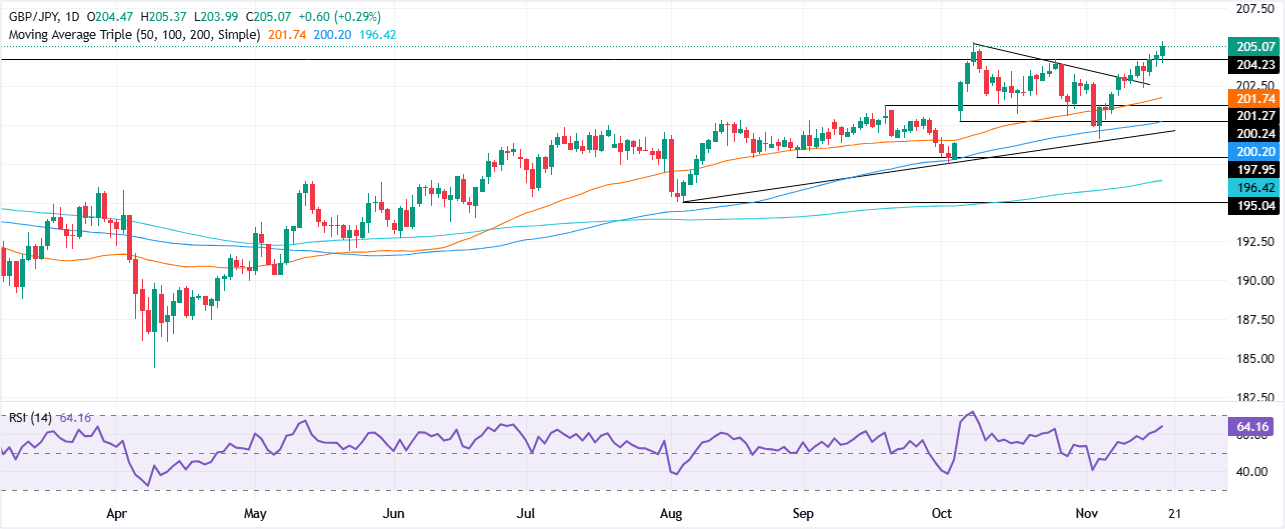
The GBP/JPY retreats somewhat after hitting 205.37, refreshing yearly highs, though bullish momentum is retained. The pair’s printed successive higher highs and higher lows, indicating that momentum favors buyers. Also, the Relative Strength Index (RSI) aims higher in bullish territory, another signal that reinforces bulls’ chances for higher prices.
The GBP/JPY key resistance levels are 205.37, the 205.50 figure and the 206.00 mark. Once those levels are taken out, the next resistance would be July 11, 2024, high at 208.12.
On the other hand, a drop below 205.00 opens the path for a pullback. The first key demand zone would be the 204.00 mark, followed by the 20-day SMA at 202.92. On further weakness, the next stop would be the 50-day SMA At 201.86.
GBP/JPY Price Chart – Daily
Pound Sterling Price Today
The table below shows the percentage change of British Pound (GBP) against listed major currencies today. British Pound was the strongest against the Japanese Yen.
| USD | EUR | GBP | JPY | CAD | AUD | NZD | CHF | |
|---|---|---|---|---|---|---|---|---|
| USD | 0.34% | 0.69% | 0.99% | 0.45% | 0.40% | 0.91% | 0.69% | |
| EUR | -0.34% | 0.33% | 0.63% | 0.09% | 0.04% | 0.57% | 0.34% | |
| GBP | -0.69% | -0.33% | 0.29% | -0.24% | -0.29% | 0.24% | 0.01% | |
| JPY | -0.99% | -0.63% | -0.29% | -0.52% | -0.57% | -0.06% | -0.28% | |
| CAD | -0.45% | -0.09% | 0.24% | 0.52% | -0.04% | 0.47% | 0.25% | |
| AUD | -0.40% | -0.04% | 0.29% | 0.57% | 0.04% | 0.53% | 0.30% | |
| NZD | -0.91% | -0.57% | -0.24% | 0.06% | -0.47% | -0.53% | -0.23% | |
| CHF | -0.69% | -0.34% | -0.01% | 0.28% | -0.25% | -0.30% | 0.23% |
The heat map shows percentage changes of major currencies against each other. The base currency is picked from the left column, while the quote currency is picked from the top row. For example, if you pick the British Pound from the left column and move along the horizontal line to the US Dollar, the percentage change displayed in the box will represent GBP (base)/USD (quote).
Author

Christian Borjon Valencia
FXStreet
Markets analyst, news editor, and trading instructor with over 14 years of experience across FX, commodities, US equity indices, and global macro markets.


