GBP/JPY Price Analysis: Tumbles below the 162.00 figure on risk aversion
- Drops below the 20-day EMA at 162.01 after hitting a daily high at 162.59.
- GBP/JPY’s failure to break below 161.23, opened the door for further buying pressure.

The GBP/JPY is subdued as Wednesday’s Asian Pacific session begins, trading within familiar levels, unable to break above/below the 160.80-162.83 region for nine consecutive days. At the time of writing, the GBP/JPY is trading at 161.76, below the 20-day EMA.
GBP/JPY Price Analysis: Technical outlook
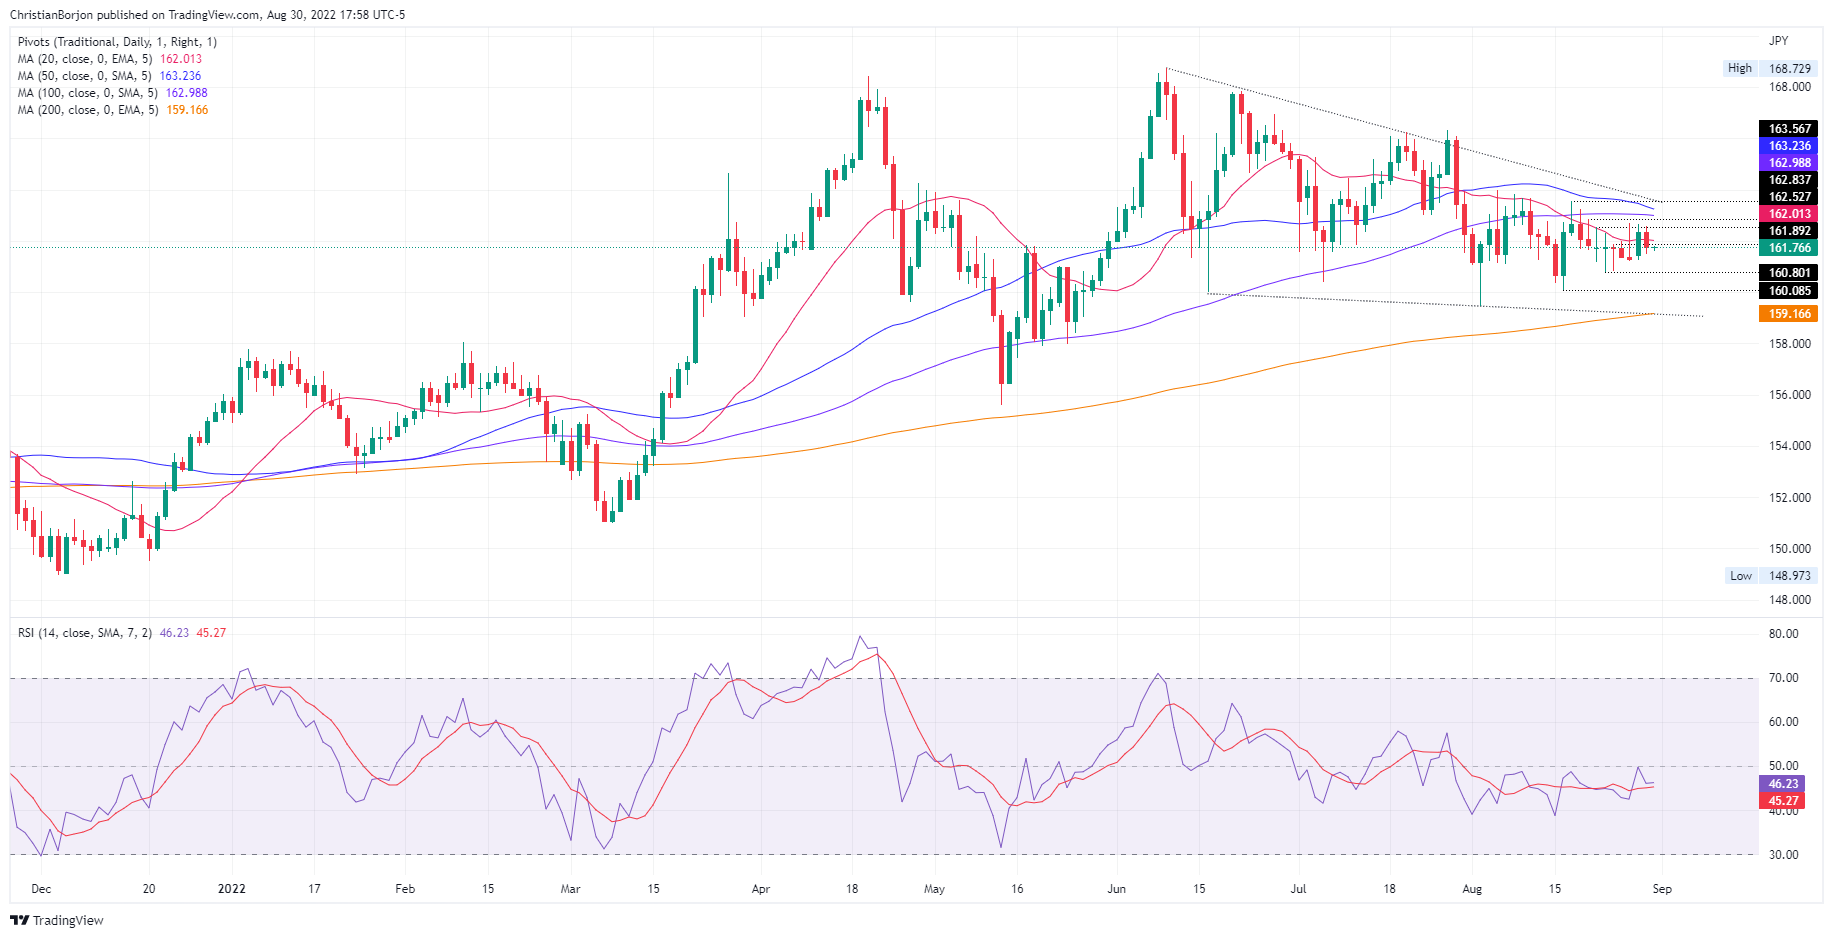
The GBP/JPY daily chart illustrates the 162.80 resistance as a solid supply zone, ahead of the 100 and the 50-day EMAs, each at 162.98 and 163.23, respectively. Also, the Relative Strength Index (RSI) slope is horizontal, further cementing the pair’s consolidation for the last 14 days.
If the GBP/JPY breaks above 162.80, it will expose the 100 and 50-day EMAs on the upper side. Once cleared, the next stop will be a three-month-old downslope trendline, drawn from the YTD highs around 168.00, which passes around the 163.70 area, ahead of the 164.00 mark.
On the other hand, the GBP/JPY’s first support would be the August 23 daily low at 161.82, followed by the 161.00 mark, followed by the August 16 low at 160.08.
GBP/JPY Key Technical Level
Author

Christian Borjon Valencia
FXStreet
Markets analyst, news editor, and trading instructor with over 14 years of experience across FX, commodities, US equity indices, and global macro markets.


