GBP/JPY Price Analysis: Tests crucial resistance zone at nine-day EMA near 189.00
- GBP/JPY may find immediate support at the lower boundary of the symmetrical triangle, located around the 187.50 level.
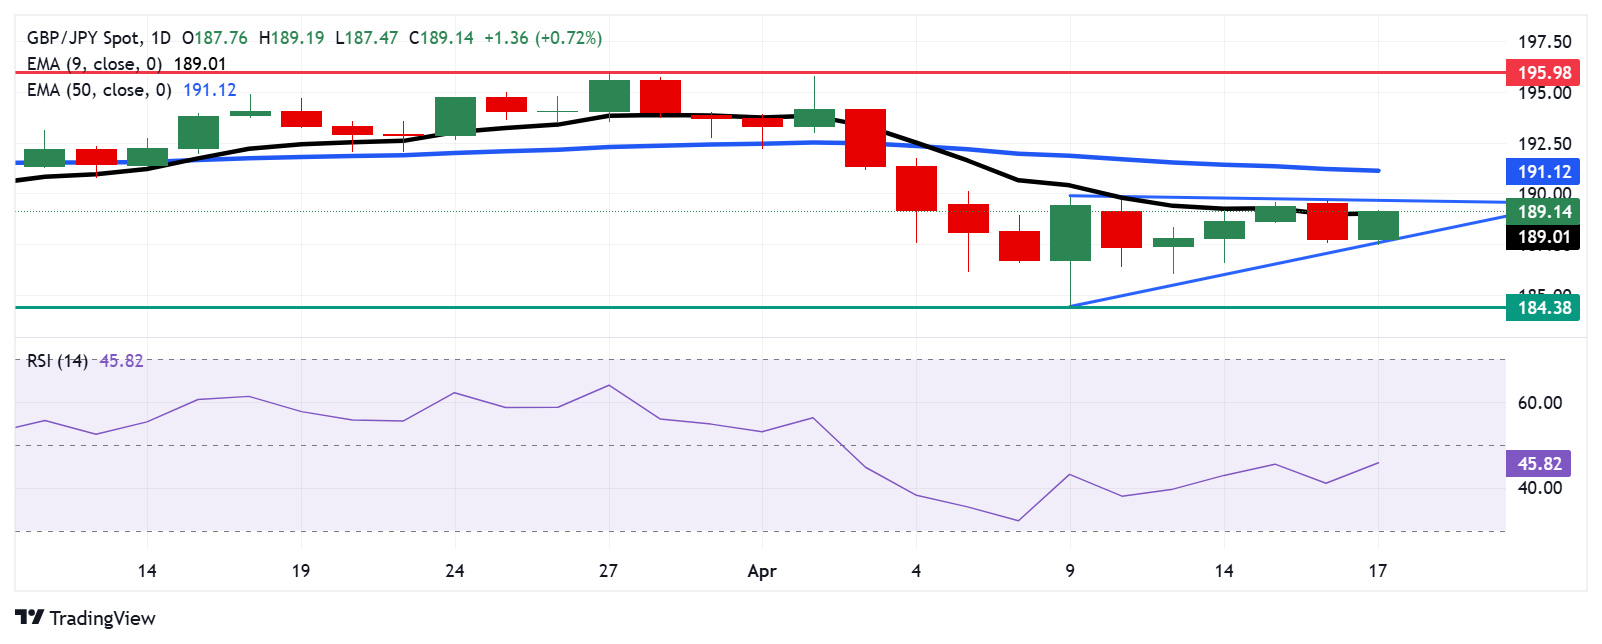
- The daily chart indicates the currency cross is consolidating within a symmetrical triangle pattern, reflecting a period of indecision.
- A confirmed breakout above the nine-day EMA at 188.96 could strengthen short-term bullish momentum.

GBP/JPY recovers its recent losses from the previous session, trading around 188.90 during the early European hours on Thursday. A look at the daily chart suggested the currency cross is moving within a symmetrical triangle pattern, suggesting a phase of consolidation that could lead to a breakout in either direction.
The 14-day Relative Strength Index (RSI), a key momentum gauge, remains below the 50 mark, signaling continued bearish pressure. Additionally, the GBP/JPY cross is attempting to break above the nine-day Exponential Moving Average (EMA). A confirmed breakout above this level could enhance short-term bullish momentum.
The GBP/JPY cross could test immediate support at the lower trendline of the symmetrical triangle near the 187.50 level. A break below this level would signal a bearish breakout, potentially opening the door for a move toward the seven-month low of 184.38, last seen on April 9.
On the upside, a break above the nine-day EMA at 188.96—closely aligned with the psychological 189.00 level—could provide bullish momentum for the GBP/JPY cross, paving the way for a test of the upper trendline of the symmetrical triangle near the 189.70 mark.
A breakout above the symmetrical triangle could signal the emergence of a bullish bias, potentially driving the GBP/JPY cross toward the 50-day EMA at the 191.11 level. A sustained move above this level may further open the path for the currency cross to challenge the three-month high around 196.10.
GBP/JPY: Daily Chart
British Pound PRICE Today
The table below shows the percentage change of British Pound (GBP) against listed major currencies today. British Pound was the strongest against the Japanese Yen.
| USD | EUR | GBP | JPY | CAD | AUD | NZD | CHF | |
|---|---|---|---|---|---|---|---|---|
| USD | 0.13% | 0.00% | 0.67% | 0.10% | 0.29% | 0.27% | 0.48% | |
| EUR | -0.13% | -0.19% | 0.50% | -0.07% | 0.13% | 0.09% | 0.32% | |
| GBP | -0.00% | 0.19% | 0.68% | 0.11% | 0.32% | 0.28% | 0.51% | |
| JPY | -0.67% | -0.50% | -0.68% | -0.56% | -0.38% | -0.49% | -0.18% | |
| CAD | -0.10% | 0.07% | -0.11% | 0.56% | 0.21% | 0.16% | 0.40% | |
| AUD | -0.29% | -0.13% | -0.32% | 0.38% | -0.21% | -0.04% | 0.18% | |
| NZD | -0.27% | -0.09% | -0.28% | 0.49% | -0.16% | 0.04% | 0.23% | |
| CHF | -0.48% | -0.32% | -0.51% | 0.18% | -0.40% | -0.18% | -0.23% |
The heat map shows percentage changes of major currencies against each other. The base currency is picked from the left column, while the quote currency is picked from the top row. For example, if you pick the British Pound from the left column and move along the horizontal line to the US Dollar, the percentage change displayed in the box will represent GBP (base)/USD (quote).
Author

Akhtar Faruqui
FXStreet
Akhtar Faruqui is a Forex Analyst based in New Delhi, India. With a keen eye for market trends and a passion for dissecting complex financial dynamics, he is dedicated to delivering accurate and insightful Forex news and analysis.


