|

GBP/JPY Price Analysis: Surges above the 183.90 area following UK GDP data

  • GBP/JPY edges higher to 183.90 following the UK GDP data.
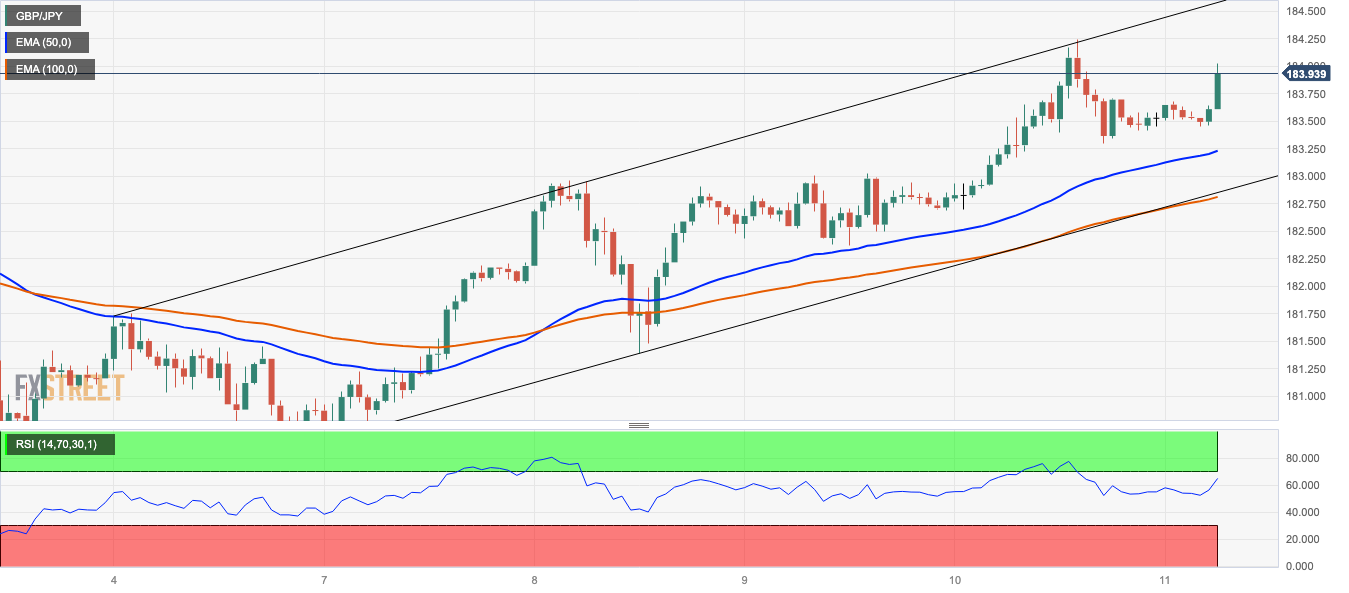
  • The cross trades within an ascending trend-channel since August 4.
  • GBP/JPY’s key resistance emerges at 184.00; the initial contention level to watch is at 183.20.

The GBP/JPY cross gains ground in positive territory for the fifth consecutive day, heading into the early European session on Friday. The cross currently trades near 183.90, up 0.24% for the day.

The latest data released by the UK’s Office of National Statistics (ONS) showed that the quarterly Gross Domestic Product (GDP) for the United Kingdom came in at 0.2% in Q2, against the market expectation of 0%. Meanwhile, the GDP MoM for June arrived at 0.5% vs. 0.2% prior.

According to the one-hour chart, the GBP/JPY trades within an ascending trend-channel since August 4. The cross stands above the 50- and 100-hour Exponential Moving Averages (EMAs) with an upward slope, which means the further upside looks favourable for the cross.

That said, GBP/JPY’s key resistance emerges at 184.00, highlighting a confluence of a psychological round mark and a high of July 6. A decisive break above the latter could pave the way to the YTD high at 184.25. Any meaningful follow-through buying will see the next stop at 184.55 (the upper boundary of an ascending trend-channel) en route to 185.00 (a round figure).

On the downside, the initial contention level to watch is at 183.20 (50-hour EMA). The critical support level is located at 182.80, a convergence of the lower limit of the ascending trend-channel and the 100-hour EMA. Further south, the cross will see a drop to 182.00 (a psychological round figure) and 181.40 (the low of August 8).

The Relative Strength Index (RSI) is located in bullish territory above 50, highlighting that further upside cannot be ruled out. 

GBP/JPY one-hour chart

GBP/JPY

Overview
Today last price183.61
Today Daily Change0.14
Today Daily Change %0.08
Today daily open183.47
 
Trends
Daily SMA20181.65
Daily SMA50180.66
Daily SMA100174.44
Daily SMA200168.52
 
Levels
Previous Daily High184.25
Previous Daily Low182.69
Previous Weekly High183.25
Previous Weekly Low180.46
Previous Monthly High184.02
Previous Monthly Low176.32
Daily Fibonacci 38.2%183.65
Daily Fibonacci 61.8%183.28
Daily Pivot Point S1182.69
Daily Pivot Point S2181.91
Daily Pivot Point S3181.13
Daily Pivot Point R1184.25
Daily Pivot Point R2185.03
Daily Pivot Point R3185.81

Author

Lallalit Srijandorn

Lallalit Srijandorn is a Parisian at heart. She has lived in France since 2019 and now becomes a digital entrepreneur based in Paris and Bangkok.

More from Lallalit Srijandorn
Share:

Editor's Picks

EUR/USD eyes nine-day EMA barrier after rebounding from 1.1600

EUR/USD gains ground after registering modest losses in the previous session, trading around 1.1620 during the Asian hours on Friday. The technical analysis of the daily chart suggests an ongoing bearish bias as the pair remains within the descending channel pattern.

GBP/USD drifts lower heading into NFP range

GBP/USD edged lower by 0.2% on Thursday, settling close to 1.3350 in a strained trading session that kept the pair pinned near three-month lows. Price briefly recovered earlier in the day on reports that Iran had indirectly signaled openness to talks with the CIA, but the bounce faded as Israeli officials reportedly advised Washington to disregard the overture. 

Gold recovers above $5,100 ahead of US NFP report

Gold price jumps back above $5,100 in the Asian session on Friday. The precious metal regains traction, helped by a fresh bout of US Dollar selling and persisting risk-off flows. The US employment report for February will take center stage later on Friday. 

NYSE parent Intercontinental Exchange partners with OKX, invests at a $25B valuation

OKX announced an investment from Intercontinental Exchange, raising its valuation to $25 billion, alongside a partnership to expand regulated crypto futures and tokenized equity offerings globally.

The market compass is pointing at a barrel of Oil

The Asian open is arriving with equities leaning the wrong way, and the reason is not complicated. The market’s compass needle has snapped firmly toward crude. In this tape, oil is not just another input price; it is the gravitational center around which every asset class is orbiting.

Ripple tests recovery strength amid steady ETF inflows, growing retail interest

Ripple (XRP) continues to demonstrate notable resilience as the cryptocurrency market navigates the persistent war in the Middle East after the United States (US) and Israel attacked Iran on Saturday.