GBP/JPY Price Analysis: Snaps two-days of losses, climbs above 166.50
- The GBP/JPY hurdled the 100, 50, and 20-day EMAs on Monday and gained 170 pips.
- GBP/JPY Price Analysis: Short term, the pair might pull back before resuming the uptrend.

The GBP/JPY snaps two days of consecutive losses and breaches the 100, 50, and 20-day Exponential Moving Averages (EMAs), rallying more than 170 pips on Monday. In the meantime, the GBP/JPY is trading at 166.68 as the Asian Pacific session begins, registering minuscule losses of 0.07%.
GBP/JPY Price Analysis: Technical outlook
From a daily chart perspective, the GBP/JPY is neutral-upward biased, testing the 20-day EMA at 166.61 after bouncing from daily lows around the 100-day EMA at 164.83. Nevertheless, as the daily EMAs remain almost flat and the Relative Strength Index (RSI) and the Rate of Change (RoC) are practically horizontal, it suggests that the pair might consolidate.
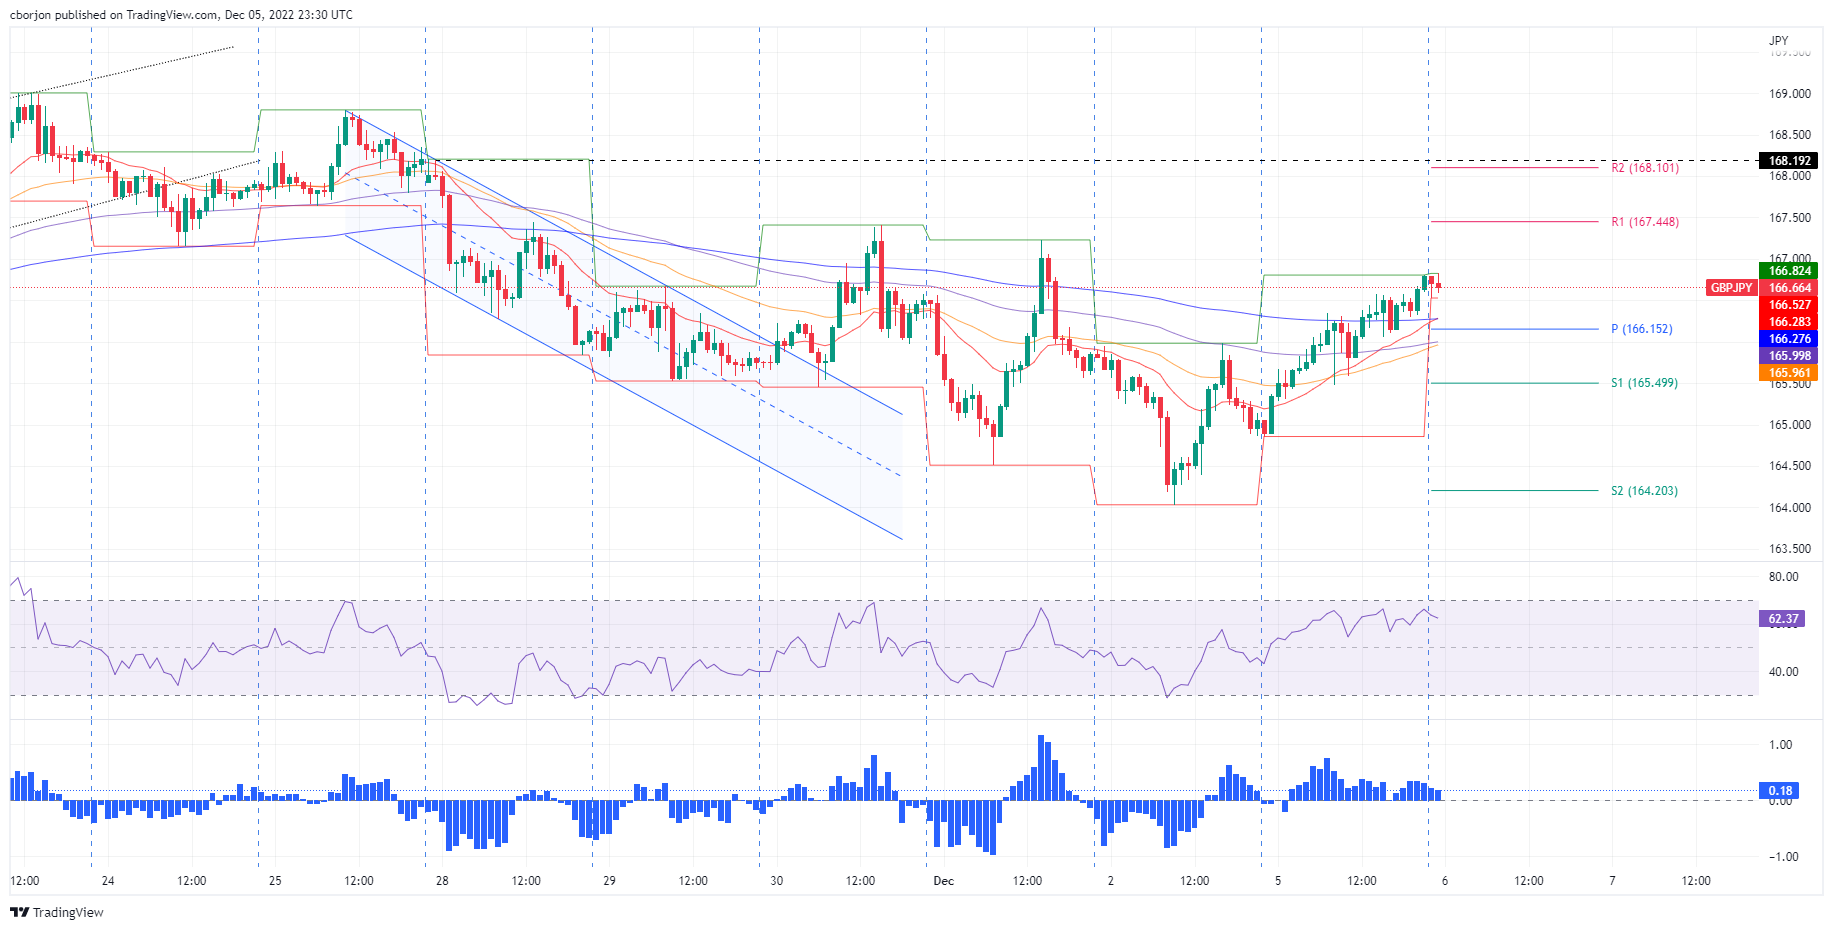
Short term, the GBP/JPY 1-hour chart illustrates the pair as upward biased. Albeit price action is registering successive series of higher highs/lows, the RSI and the ROC are doing the opposite, portraying a negative divergence.
Hence, the GBP/JPY could fall further before resuming its uptrend. Therefore, the GBP/JPY first support would be the daily pivot at 166.15, followed by the S1 pivot level at 165.49. Break below will expose the December 5 low of 164.85.
Author

Christian Borjon Valencia
FXStreet
Markets analyst, news editor, and trading instructor with over 14 years of experience across FX, commodities, US equity indices, and global macro markets.


