|

GBP/JPY Price Analysis: Rising wedge challenges recovery around mid-166.00s

  • GBP/JPY prints mild gains within bearish chart formation.
  • Downbeat MACD signals, clear break of three-week-old previous support line keeps sellers hopeful.
  • 100, 200 SMAs can prod bears before directing them to theoretical target of 162.30.
  • Bulls need to cross the 167.00 hurdle to retake control.

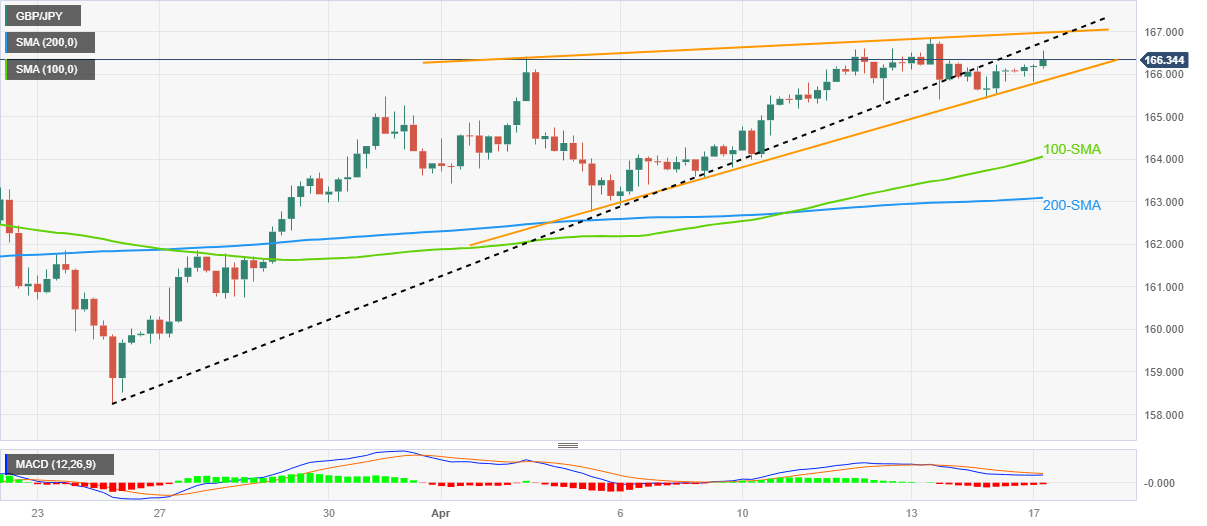
GBP/JPY remains mildly bid near 166.40 heading into Monday’s London open. In doing so, the cross-currency pair struggles to defend the four-day uptrend inside a short-term rising wedge bearish chart formation.

That said, the bearish MACD signals and the quote’s downside break of an upward-sloping support line from late March, now immediate resistance around 166.80, adds strength to the downside bias.

However, a clear break of the stated wedge’s lower line, close to 165.80 at the latest, becomes necessary for the GBP/JPY bear’s conviction.

Even so, the 100-SMA and the 200-SMA, respectively near 164.00 and 163.00, can challenge the cross-currency pair’s likely fall past 166.80 towards the theoretical target of around 162.30.

It’s worth noting that the monthly low of around 162.80 also acts as an extra filter towards the south.

Meanwhile, GBP/JPY recovery needs to cross the previous support line, close to 166.80, to convince intraday buyers.

Following that, the stated wedge’s top line and the recent high, close to 167.00, may test the upside before defying the bearish chart formation.

In that case, a run-up towards the late 2022 peak of around 169.30 and then towards the 170.00 round figure can’t be ruled out.

Overall, GBP/JPY buyers appear to run out of steam ahead of the key data week for the UK.

GBP/JPY: Four-hour chart

Trend: Pullback expected

Additional important levels

Overview
Today last price166.32
Today Daily Change0.25
Today Daily Change %0.15%
Today daily open166.07
 
Trends
Daily SMA20163.53
Daily SMA50162.46
Daily SMA100162.17
Daily SMA200163.21
 
Levels
Previous Daily High166.23
Previous Daily Low165.42
Previous Weekly High166.85
Previous Weekly Low163.81
Previous Monthly High165.47
Previous Monthly Low158.27
Daily Fibonacci 38.2%165.92
Daily Fibonacci 61.8%165.73
Daily Pivot Point S1165.58
Daily Pivot Point S2165.09
Daily Pivot Point S3164.77
Daily Pivot Point R1166.4
Daily Pivot Point R2166.72
Daily Pivot Point R3167.21

Author

Anil Panchal

Anil Panchal

FXStreet

Anil Panchal has nearly 15 years of experience in tracking financial markets. With a keen interest in macroeconomics, Anil aptly tracks global news/updates and stays well-informed about the global financial moves and their implications.

More from Anil Panchal
Share:

Markets move fast. We move first.

Orange Juice Newsletter brings you expert driven insights - not headlines. Every day on your inbox.

By subscribing you agree to our Terms and conditions.

Editor's Picks

EUR/USD moves sideways below 1.1800 on Christmas Eve

EUR/USD struggles to find direction and trades in a narrow channel below 1.1800 after posting gains for two consecutive days. Bond and stock markets in the US will open at the usual time and close early on Christmas Eve, allowing the trading action to remain subdued. 

GBP/USD keeps range around 1.3500 amid quiet markets

GBP/USD keeps its range trade intact at around 1.3500 on Wednesday. The Pound Sterling holds the upper hand over the US Dollar amid pre-Christmas light trading as traders move to the sidelines heading into the holiday season. 

Gold retreats from record highs, trades below $4,500

Gold retreats after setting a new record-high above $4,520 earlier in the day and trades in a tight range below $4,500 as trading volumes thin out ahead of the Christmas break. The US Dollar selling bias remains unabated on the back of dovish Fed expectations, which continues to act as a tailwind for the bullion amid persistent geopolitical risks.

Bitcoin slips below $87,000 as ETF outflows intensify, whale participation declines

Bitcoin price continues to trade around $86,770 on Wednesday, after failing to break above the $90,000 resistance. US-listed spot ETFs record an outflow of $188.64 million on Tuesday, marking the fourth consecutive day of withdrawals.

Economic outlook 2026-2027 in advanced countries: Solidity test

After a year marked by global economic resilience and ending on a note of optimism, 2026 looks promising and could be a year of solid economic performance. In our baseline scenario, we expect most of the supportive factors at work in 2025 to continue to play a role in 2026.

Avalanche struggles near $12 as Grayscale files updated form for ETF

Avalanche trades close to $12 by press time on Wednesday, extending the nearly 2% drop from the previous day. Grayscale filed an updated form to convert its Avalanche-focused Trust into an ETF with the US Securities and Exchange Commission.