|

GBP/JPY Price Analysis: Key hurdle at 136.73 comes into play

  • GBP/JPY runs into confluence of a Fibonacci and 200-day SMA hurdles. 
  • A close higher could invite more substantial chart-driven buying. 

GBP/JPY proved resistance at 136.73 a few minutes before press time. That level is the 38.2% Fibonacci retracement of the sell-off from the Sept. 1 high of 142.72 to the Sept. 22 low of 133.04. 

Notably, the 200-day simple moving average (SMA) is located at 136.68 – just below the critical Fibonacci retracement. 

A close above these levels would validate the daily chart MACD histogram's bullish or above-zero reading, the ascending 5- and 10-day SMAs, and could fuel a stronger rise to 138.25 (Aug. 21 low). 

Bulls, however, failed to keep gains above the 38.2% Fibonacci retracement on Oct. 1. Another failure will likely see the market re-test dip demand by revisiting the 10-day SMA at 135.23. 

Daily chart

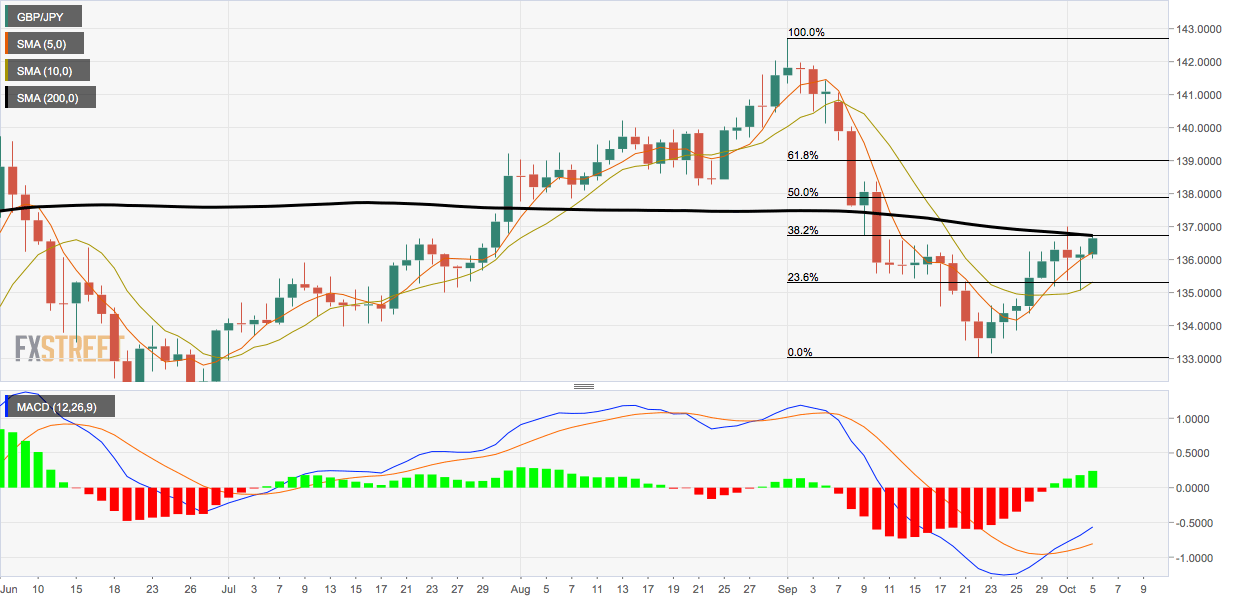
Trend: bullish above 136.73

Technical levels

GBP/JPY

Overview
Today last price136.65
Today Daily Change0.49
Today Daily Change %0.36
Today daily open136.16
 
Trends
Daily SMA20135.84
Daily SMA50137.83
Daily SMA100136.06
Daily SMA200136.76
 
Levels
Previous Daily High136.4
Previous Daily Low135.06
Previous Weekly High137.01
Previous Weekly Low134.37
Previous Monthly High142.72
Previous Monthly Low133.05
Daily Fibonacci 38.2%135.88
Daily Fibonacci 61.8%135.57
Daily Pivot Point S1135.34
Daily Pivot Point S2134.53
Daily Pivot Point S3134
Daily Pivot Point R1136.68
Daily Pivot Point R2137.21
Daily Pivot Point R3138.02

Author

Omkar Godbole

Omkar Godbole

FXStreet Contributor

Omkar Godbole, editor and analyst, joined FXStreet after four years as a research analyst at several Indian brokerage companies.

More from Omkar Godbole
Share:

Editor's Picks

EUR/USD rises to 1.1800 neighborhood amid renewed USD selling and trade uncertainties

The EUR/USD pair regains positive traction during the Asian session on Wednesday and jumps to the 1.1800 neighborhood in the last hour, reversing the previous day's modest losses. The intraday move up is sponsored by the emergence of fresh US Dollar, which continues to be weighed down by persistent trade-related uncertainties.

GBP/USD remains stronger above 1.3500 following Trump’s State of the Union

GBP/USD remains in the positive territory for the fourth successive session, trading around 1.3510 during the Asian hours on Wednesday. The pair appreciates as the US Dollar remains subdued following US President Donald Trump’s first State of the Union address of his second administration before a joint session of Congress.

Gold re-attempts $5,200 amid tariffs and geopolitical woes

Gold buyers are back in the game early Wednesday after seeing a correction from monthly highs on Tuesday. The US Dollar slips after Trump’s SOTU fails to impress and as AI-driven worries ease. Dovish Fed bets also weigh.  Gold looks north so long as the key 61.8% Fibo resistance at $5,142 holds on the daily chart.

Bitcoin, Ethereum and Ripple post cautious recovery amid downside risks

Bitcoin, Ethereum, and Ripple are posting a cautious recovery on Wednesday following a market correction earlier this week.  BTC is approaching a key breakdown level, while ETH and XRP are rebounding from crucial support levels.

The Citrini report: How a debatable AI narrative can shake Wall Street

That AI-related headline alone was enough to rattle investors.US stocks slid sharply on Monday after a widely circulated Citrini Research memo outlined a hypothetical “2028 Global Intelligence Crisis”, warning that rapid AI adoption could push US unemployment into double digits as early as by mid-2028.

Cosmos Hub Price Forecast: ATOM rebounds slightly, bearish outlook remains intact

Cosmos Hub (ATOM) price rebounds, trading above $2.05 at the time of writing on Wednesday, after undergoing a sharp correction since last week. Weakening on-chain and derivatives data support a bearish outlook, while technical analysis remains unfavorable.