GBP/JPY Price Analysis: Key DMAs test bears above 163.00


  • GBP/JPY pauses four-day downtrend at a fortnight low.
  • Impending bearish MACD signals, downbeat RSI keeps sellers hopeful.
  • A convergence of 21-DMA and 50-DMA precedes 100-DMA to restrict immediate downside.

GBP/JPY remains defensive around 163.30, holding lower ground near the two-week bottom heading into Monday’s European session. In doing so, the cross-currency pair jostles with multiple key Daily Moving Averages (DMAs) after declining for the last four consecutive days.

That said, the 21-DMA and the 50-DMA confluence near 163.30-25 appears to be the immediate support for the GBP/JPY pair ahead of the 100-DMA support near 163.00.

If at all the quote declines below 163.00, the 50% Fibonacci retracement level of May-June upside, near 162.10, precedes a four-month-old support line, near 161.60, to challenge the quote’s further declines.

In a case where the GBP/JPY prices break the 161.60 support, the odds of witnessing a south-run towards the 61.8% Fibonacci retracement level near 160.50 can’t be ruled out.

Alternatively, the 164.00 threshold precedes the tops marked in July and September, respectively near 166.30 and 167.35, which could challenge GBP/JPY buyers.

Should the cross-currency pair roses past 167.35, the yearly top marked in June around 168.75 and the 170.00 round figure will be in the spotlight.

Overall, GBP/JPY remains on the bear’s radar despite the latest inaction.

GBP/JPY: Daily chart

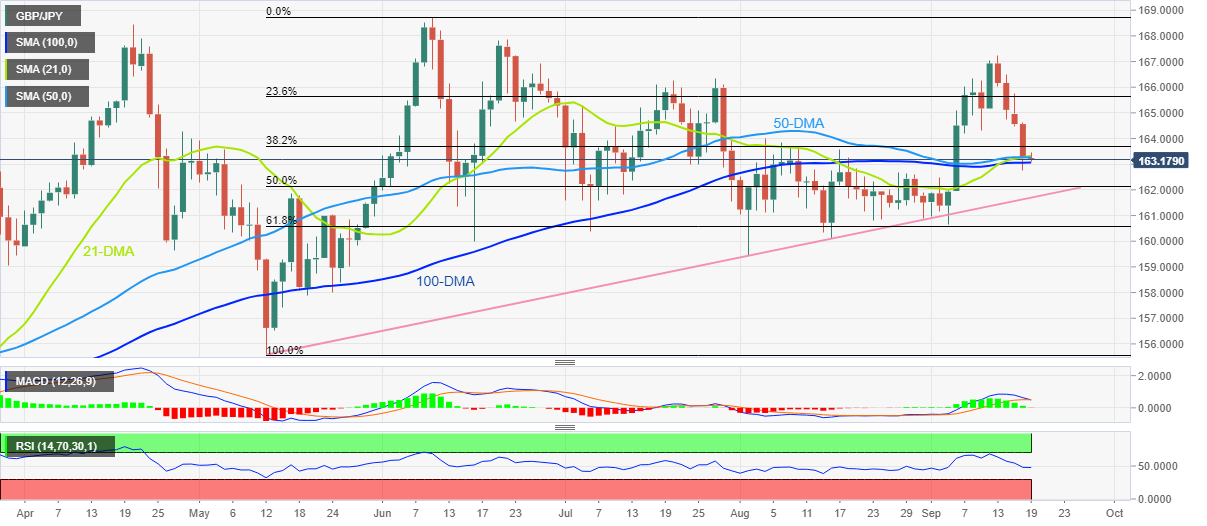
Trend: Further downside expected

Additional important levels

Overview
Today last price 163.22
Today Daily Change -0.02
Today Daily Change % -0.01%
Today daily open 163.24
 
Trends
Daily SMA20 163.33
Daily SMA50 163.27
Daily SMA100 163.06
Daily SMA200 160.05
 
Levels
Previous Daily High 164.62
Previous Daily Low 162.75
Previous Weekly High 167.22
Previous Weekly Low 162.75
Previous Monthly High 163.99
Previous Monthly Low 159.45
Daily Fibonacci 38.2% 163.46
Daily Fibonacci 61.8% 163.91
Daily Pivot Point S1 162.45
Daily Pivot Point S2 161.66
Daily Pivot Point S3 160.57
Daily Pivot Point R1 164.33
Daily Pivot Point R2 165.42
Daily Pivot Point R3 166.21


Share: Feed news

Information on these pages contains forward-looking statements that involve risks and uncertainties. Markets and instruments profiled on this page are for informational purposes only and should not in any way come across as a recommendation to buy or sell in these assets. You should do your own thorough research before making any investment decisions. FXStreet does not in any way guarantee that this information is free from mistakes, errors, or material misstatements. It also does not guarantee that this information is of a timely nature. Investing in Open Markets involves a great deal of risk, including the loss of all or a portion of your investment, as well as emotional distress. All risks, losses and costs associated with investing, including total loss of principal, are your responsibility. The views and opinions expressed in this article are those of the authors and do not necessarily reflect the official policy or position of FXStreet nor its advertisers. The author will not be held responsible for information that is found at the end of links posted on this page.

If not otherwise explicitly mentioned in the body of the article, at the time of writing, the author has no position in any stock mentioned in this article and no business relationship with any company mentioned. The author has not received compensation for writing this article, other than from FXStreet.

FXStreet and the author do not provide personalized recommendations. The author makes no representations as to the accuracy, completeness, or suitability of this information. FXStreet and the author will not be liable for any errors, omissions or any losses, injuries or damages arising from this information and its display or use. Errors and omissions excepted.

The author and FXStreet are not registered investment advisors and nothing in this article is intended to be investment advice.

Recommended content


Recommended content

Editors’ Picks

AUD/USD rises to two-day high ahead of Aussie CPI

AUD/USD rises to two-day high ahead of Aussie CPI

The Aussie Dollar recorded back-to-back positive days against the US Dollar and climbed more than 0.59% on Tuesday, as the US April S&P PMIs were weaker than expected. That spurred speculations that the Federal Reserve could put rate cuts back on the table. The AUD/USD trades at 0.6488 as Wednesday’s Asian session begins.

AUD/USD News

EUR/USD now refocuses on the 200-day SMA

EUR/USD now refocuses on the 200-day SMA

EUR/USD extended its positive momentum and rose above the 1.0700 yardstick, driven by the intense PMI-led retracement in the US Dollar as well as a prevailing risk-friendly environment in the FX universe.

EUR/USD News

Gold price cautious despite weaker US Dollar and falling US yields

Gold price cautious despite weaker US Dollar and falling US yields

Gold retreats modestly after failing to sustain gains despite fall in US Treasury yields, weaker US Dollar. XAU/USD struggles to capitalize following release of weaker-than-expected S&P Global PMIs, fueling speculation about potential Fed rate cuts.

Gold News

Ethereum continues hinting at rally following reduced long liquidations

Ethereum continues hinting at rally following reduced long liquidations

Ethereum has continued showing signs of a potential rally on Tuesday as most coins in the crypto market are also posting gains. This comes amid speculation of a potential decline following FTX ETH sales and normalizing ETH risk reversals.

Read more

Australia CPI Preview: Inflation set to remain above target as hopes of early interest-rate cuts fade

Australia CPI Preview: Inflation set to remain above target as hopes of early interest-rate cuts fade

An Australian inflation update takes the spotlight this week ahead of critical United States macroeconomic data. The Australian Bureau of Statistics will release two different inflation gauges on Wednesday.

Read more

Forex MAJORS

Cryptocurrencies

Signatures