|

GBP/JPY Price Analysis: Holds steady amid hawkish BoJ; sellers eye 183.00

  • Strong Chinese data and hawkish comments by BoJ Governor Ueda underpinned the JPY.
  • The pair is neutral to upward biased from a daily chart, at the brisk of breaching the Ichimoku cloud.
  • Short term, the GBP/JPY is downward biased, set to test the 183.00 area.

The Pound Sterling (GBP) stops its decline vs. the Japanese Yen (JPY) as Tuesday’s Asian session begins, following Monday’s session that witnessed a 0.47% loss for the cross-currency pair. The reasons behind the move were good Chinese data and some hawkish comments by the Bank of Japan (BoJ) Governor Kazuo Ueda. The GBP/JPY is trading at 183.38, a gain 0.06%.

GBP/JPY Price Analysis: Technical outlook

From a daily chart perspective, the pair is neutral to upward biased, remaining above the Ichimoku Cloud  (Kumo). Nevertheless, since the cross printed the yearly high, the GBP/JPY achieved successive series of lower highs and lows, keeping that neutral stance on the cross. Also, an upslope support trendline, drawn from March 2023 lows, passes around 183.00. That said, a decisive break below the latter could open the door for further downside.

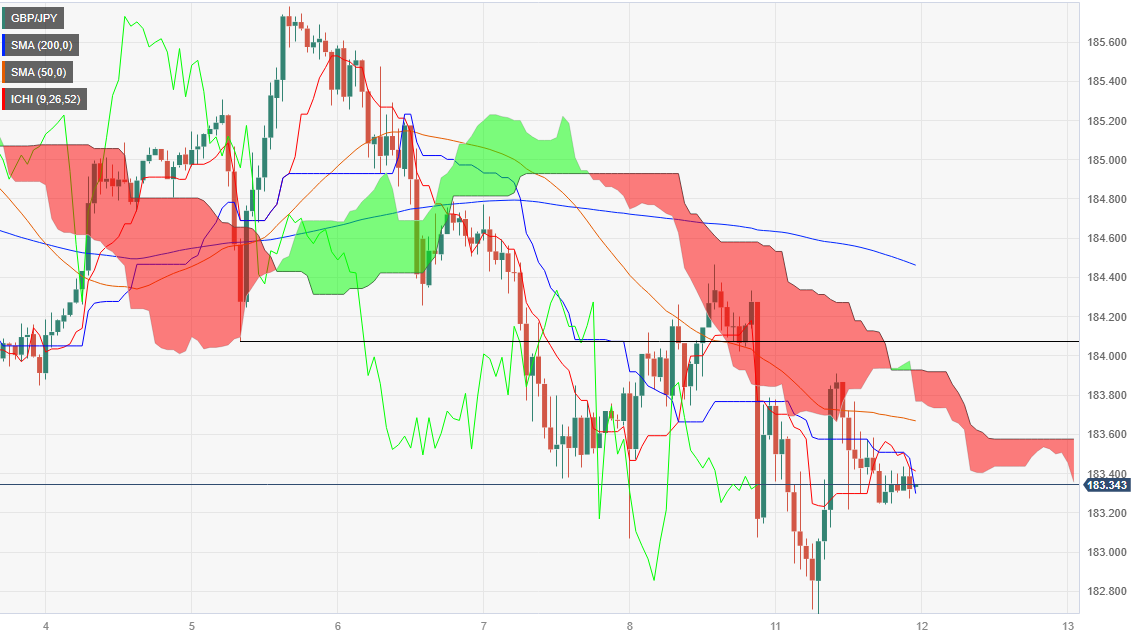
Short term, the GBP/JPY is set to extend its losses, capped on the upside by the Senkou Span B at 183.57. Once cleared, the pair’s next stop would be the bottom of the Ichimoku Cloud (Kumo) at around the 183.70 area, followed by a challenge of the 184.00 figure. Conversely, and the path of least resistance, the first support would be the 183.20 area. Once cleared, the cross would dive towards the 183.00 figure, followed by the September 11 daily low at 182.67.

GBP/JPY Price Action – Hourly chart

GBP/JPY

Overview
Today last price183.32
Today Daily Change-0.96
Today Daily Change %-0.52
Today daily open184.28
 
Trends
Daily SMA20184.92
Daily SMA50183.14
Daily SMA100178.67
Daily SMA200170.45
 
Levels
Previous Daily High184.47
Previous Daily Low183.07
Previous Weekly High185.78
Previous Weekly Low183.07
Previous Monthly High186.77
Previous Monthly Low180.46
Daily Fibonacci 38.2%183.93
Daily Fibonacci 61.8%183.6
Daily Pivot Point S1183.41
Daily Pivot Point S2182.54
Daily Pivot Point S3182.01
Daily Pivot Point R1184.81
Daily Pivot Point R2185.34
Daily Pivot Point R3186.21
 

Author

Christian Borjon Valencia

Markets analyst, news editor, and trading instructor with over 14 years of experience across FX, commodities, US equity indices, and global macro markets.

More from Christian Borjon Valencia
Share:

Editor's Picks

EUR/USD slumps below 1.1750 as USD benefits from risk-aversion

EUR/USD comes under renewed bearish pressure in the European session and trades below 1.1750 following a recovery attempt earlier in the day. The US Dollar gathers strength and weighs on the pair as investors seek refuge in the wake of Israel and the United States' joint attack on Iran.

GBP/USD targets 1.3500 barrier near moving averages

GBP/USD rebounds from the daily losses, trading around 1.3450 during the Asian hours on Monday. The technical analysis of the daily chart indicates an ongoing bearish bias, as the pair trades within a descending channel pattern.

Gold surges on safe-haven demand, rises above $5,400

Gold benefits from intense risk-aversion on Monday and climbs above $5,400, setting a fresh monthly-high in the process. Tensions in the Middle East remain high as Israel and Hezbollah continue to exchange strikes following the US-Israel joint attack on Iran over the weekend.

Bitcoin, Ethereum and Ripple under pressure as key supports face breakdown risk

Bitcoin, Ethereum, and Ripple prices trade on the back foot at the start of this week on Monday, after extending losses in the previous week. BTC is on the brink of a breakdown, ETH is capped below key resistance, and XRP risks a crack of the trendline.

The market is paying for insurance, not apocalypse

As expected, this morning felt less like a Monday market open and more like a fire drill. Futures screens flickered red. S&P contracts down almost 1%. Nasdaq off 1.2%. Brent leaped 13% through $80. Gold rose 1.6% toward $5350 before paring some gains. The dollar is strutting mildly. The Swiss franc is quietly doing what it always does in a storm, catching some safe-haven flows.

Pi Network Price Forecast: Core team offloads supply, weighing on PI recovery

Pi Network  hovers below $0.1700, broadly steady at press time on Monday, attempting a recovery after a 2% loss the previous day. Sunday’s decline aligned with nearly 49 million PI tokens offloaded by the Pi Foundation, implying a spike in supply pressure that capped the prevailing four-day recovery.