|

GBP/JPY Price Analysis: Dips for third straight day, with bears firmly in charge

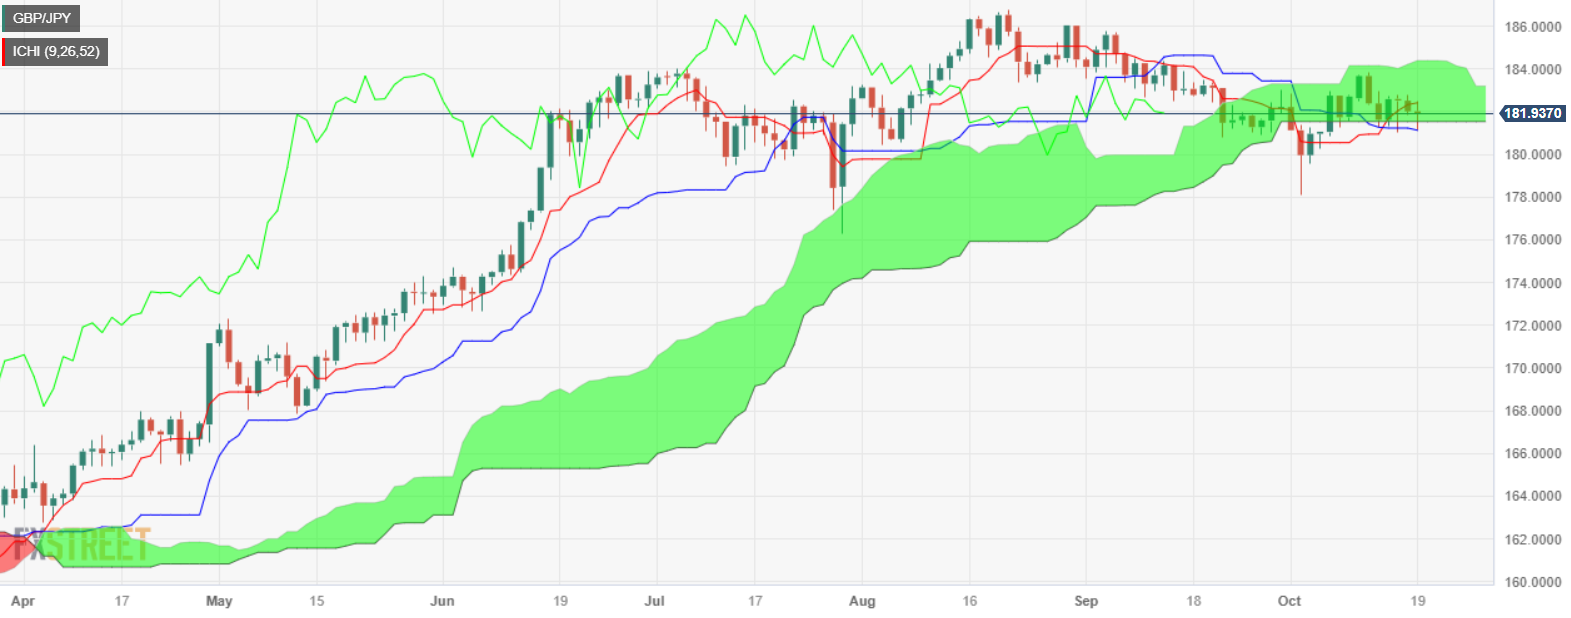
  • GBP/JPY daily chart shows the pair trading near the bottom of the Ichimoku Cloud (Kumo).
  • Initial support is seen at 181.50/55; clearing this could lead to tests of 18.00 and the October 3 swing low at 178.31.
  • First resistance at 182.00, followed by the week's high of 182.81.

The GBP/JPY trends lower late in the New York session after hitting a daily high of 182.51, though a deterioration in sentiment spurred outflows from the Pound Sterling (GBP) toward the safe-haven status of the Japanese Yen (JPY). The cross-pair is trading at 181.98, down 0.01%.

From a technical standpoint, the GBP/JPY daily chart portrays the pair as subdued, exchanging hands inside the Ichimoku Cloud (Kumo) near the bottom of the Kumo. If the pair clears the initial support seen at 181.50/55, that will pave the way to test 18.00, followed by the October 3 swing low of 178.31. Further downside is expected at July 28 daily and the latest cycle low at 176.30.

Conversely, the GBP/JPY first resistance would be the 182.00 figure, followed by the current week’s high of 182.81. Additional upside risks are above the 183.00 mark, like the top of the Kumo at around 184.50/75.

GBP/JPY Price Action – Daily chart

GBP/JPY Technical Levels

GBP/JPY

Overview
Today last price182
Today Daily Change-0.02
Today Daily Change %-0.01
Today daily open182.02
 
Trends
Daily SMA20181.87
Daily SMA50183.39
Daily SMA100181.93
Daily SMA200173.19
 
Levels
Previous Daily High182.81
Previous Daily Low181.85
Previous Weekly High183.82
Previous Weekly Low181.26
Previous Monthly High185.78
Previous Monthly Low180.82
Daily Fibonacci 38.2%182.22
Daily Fibonacci 61.8%182.45
Daily Pivot Point S1181.64
Daily Pivot Point S2181.26
Daily Pivot Point S3180.68
Daily Pivot Point R1182.61
Daily Pivot Point R2183.19
Daily Pivot Point R3183.57

Author

Christian Borjon Valencia

Markets analyst, news editor, and trading instructor with over 14 years of experience across FX, commodities, US equity indices, and global macro markets.

More from Christian Borjon Valencia
Share:

Editor's Picks

EUR/USD rises to 1.1800 neighborhood amid renewed USD selling and trade uncertainties

The EUR/USD pair regains positive traction during the Asian session on Wednesday and jumps to the 1.1800 neighborhood in the last hour, reversing the previous day's modest losses. The intraday move up is sponsored by the emergence of fresh US Dollar, which continues to be weighed down by persistent trade-related uncertainties.

GBP/USD remains stronger above 1.3500 following Trump’s State of the Union

GBP/USD remains in the positive territory for the fourth successive session, trading around 1.3510 during the Asian hours on Wednesday. The pair appreciates as the US Dollar remains subdued following US President Donald Trump’s first State of the Union address of his second administration before a joint session of Congress.

Gold re-attempts $5,200 amid tariffs and geopolitical woes

Gold buyers are back in the game early Wednesday after seeing a correction from monthly highs on Tuesday. The US Dollar slips after Trump’s SOTU fails to impress and as AI-driven worries ease. Dovish Fed bets also weigh.  Gold looks north so long as the key 61.8% Fibo resistance at $5,142 holds on the daily chart.

Bitcoin, Ethereum and Ripple post cautious recovery amid downside risks

Bitcoin, Ethereum, and Ripple are posting a cautious recovery on Wednesday following a market correction earlier this week.  BTC is approaching a key breakdown level, while ETH and XRP are rebounding from crucial support levels.

The Citrini report: How a debatable AI narrative can shake Wall Street

That AI-related headline alone was enough to rattle investors.US stocks slid sharply on Monday after a widely circulated Citrini Research memo outlined a hypothetical “2028 Global Intelligence Crisis”, warning that rapid AI adoption could push US unemployment into double digits as early as by mid-2028.

XRP pressured by weak ETF flows and declining retail interest

Ripple (XRP) is edging lower, trading above its intraday low of $1.32 at the time of writing on Tuesday. The decline from its weekly opening of $1.39 reflects heightened volatility in the broader cryptocurrency market, accentuated by tariff-triggered uncertainty.