|

GBP/JPY Price Analysis: Clings to 172.00 on risk-off impulse, as UK’s inflation remains high

  • Despite trading within a range, the GBP/JPY maintains an upward bias, bolstered by UK inflation figures and expectations of further tightening by the Bank of England.
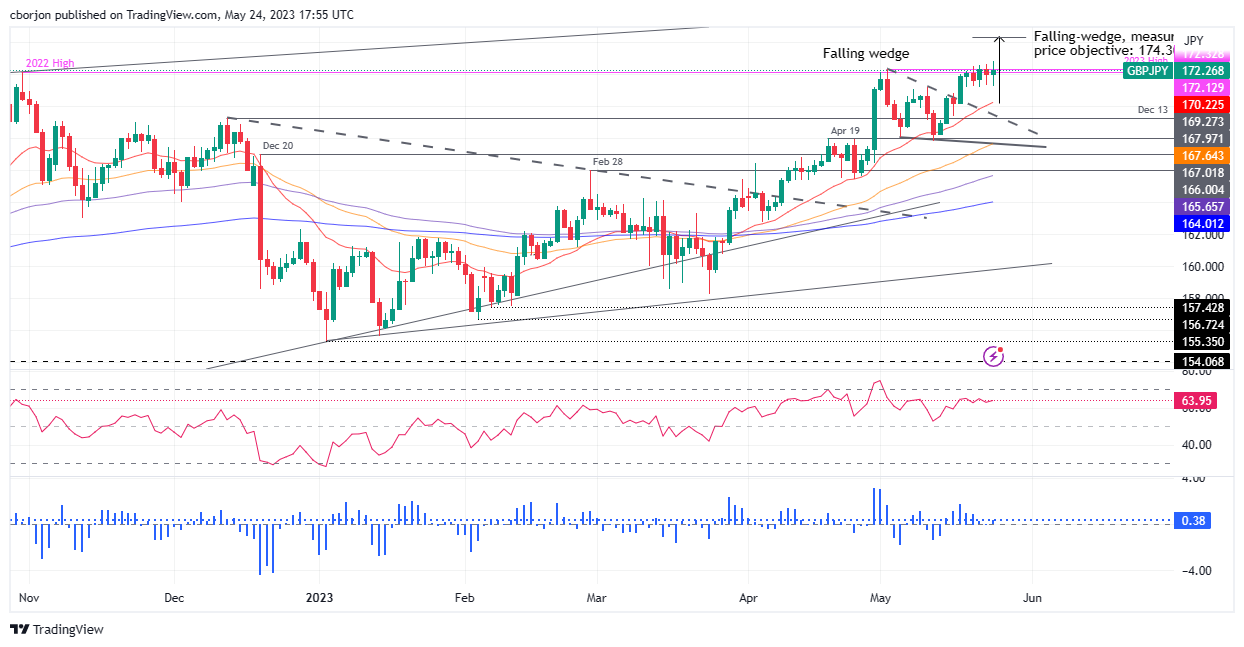
  • GBP/JPY faces a potential pullback, suggested by the negative divergence between its price action and the Relative Strength Index (RSI), with support at 172.00 and the 20-day EMA at 170.27.
  • Further gains may be expected if GBP/JPY surpasses 173.00, with the falling wedge measuring an objective of 174.30.

GBP/JPY clings to the 172.00 figure amidst a risk-off impulse as the US debt ceiling woes and the release of the US Federal Reserve (Fed) May minutes loom. Therefore, investors seeking safety moved toward safe-haven peers, except for the Japanese Yen (JPY), weakening against the Pound Sterling (GBP). At the time of writing, the GBP/JPY is trading around 172.30s.

GBP/JPY Price Analysis: Technical outlook

The GBP/JPY continues to trade within a range between the 171.22-172.79 area after inflation figures in the United Kingdom (UK) cooled down, except for the April Core Consumer Price Index (CPI) jumping by 6.8%, above the prior’s month and the consensus 6.2%. That underpinned the GBP as expectations for additional tightening by the Bank of England (BoE) increased.

The GBP/JPY is still upward biased, but since the break of a falling wedge, the pair’s rally towards the measured objective at 174.30 stalled. In n article written on May 23, I wrote: “After three consecutive sessions, the GBP/JPY failed to reach the 173.00 area, which, once cleared, could pave the way towards the 174.00 figure, ahead of getting the measured objective of the falling wedge.” However, Wednesday what no exception to the rule, as the GBP/JPY reached a high of 172.79 but retreated more than 50 pips, oscillating around 172.20s.

As the GBP/JPY price action achieved successive higher highs, the Relative Strength Index (RSI) indicator prints lower peaks. That means a negative divergence between price action and the RSI could open the door for a pullback.

Hence, the GBP/JPY first support is the 172.00 mark. A break below and the GBP/JPY will reach the 20-day Exponential Moving Average (EMA) at 170.27, with the 170.00 figure up for grabs.

On the flip side, if GBP/JPY hits 173.00, that could pave the way for further gains, lile the falling wedge measured an objective of 174.30.

GBP/JPY Price Action – Daily chart

GBP/JPY Daily chart

GBP/JPY

Overview
Today last price172.28
Today Daily Change0.27
Today Daily Change %0.16
Today daily open172.01
 
Trends
Daily SMA20170.23
Daily SMA50166.53
Daily SMA100163.66
Daily SMA200164.02
 
Levels
Previous Daily High172.63
Previous Daily Low171.29
Previous Weekly High172.51
Previous Weekly Low168.91
Previous Monthly High171.18
Previous Monthly Low162.78
Daily Fibonacci 38.2%171.8
Daily Fibonacci 61.8%172.12
Daily Pivot Point S1171.32
Daily Pivot Point S2170.64
Daily Pivot Point S3169.98
Daily Pivot Point R1172.66
Daily Pivot Point R2173.32
Daily Pivot Point R3174

Author

Christian Borjon Valencia

Markets analyst, news editor, and trading instructor with over 14 years of experience across FX, commodities, US equity indices, and global macro markets.

More from Christian Borjon Valencia
Share:

Editor's Picks

EUR/USD: Breakdown below trading range support near 1.1770 comes into play

The EUR/USD pair opens with a bearish gap at the start of a new week as the US-Iran war-led global flight to safety boosts the US Dollar. Spot prices, however, lack follow-through selling and manage to hold above mid-1.1700s during the Asian session.

GBP/USD targets 1.3500 barrier near moving averages

GBP/USD rebounds from the daily losses, trading around 1.3450 during the Asian hours on Monday. The technical analysis of the daily chart indicates an ongoing bearish bias, as the pair trades within a descending channel pattern.

Gold retreats from $5,400; still up over 1% amid Middle East tensions

Gold retreats from the $5,400 neighborhood, or its highest level since late January, touched in the Asian session on Monday, though it manages to hold above the $5,300 round figure. The bright metal opened with a bullish gap of about $17 and rallied toward the $5,400 level as Asian traders hit their desks and reacted negatively to the weekend news of the US and Israel attacks on Iran, rushing for cover in Gold.

Top Crypto Losers: Tezos, Toncoin, and Polkadot at crucial levels amid US-Israel strike on Iran

Altcoins such as Tezos, Toncoin, and Polkadot rank among the worst hit cryptocurrencies over the last 24 hours amid the US and Israel's attack on Iran. Tezos and Toncoin are down to crucial support levels while Polkadot remains near a crucial resistance trendline, showcasing underlying strength.

The market is paying for insurance, not apocalypse

As expected, this morning felt less like a Monday market open and more like a fire drill. Futures screens flickered red. S&P contracts down almost 1%. Nasdaq off 1.2%. Brent leaped 13% through $80. Gold rose 1.6% toward $5350 before paring some gains. The dollar is strutting mildly. The Swiss franc is quietly doing what it always does in a storm, catching some safe-haven flows.

Starknet unveils strkBTC, shielded Bitcoin transactions on Ethereum Layer 2

Starknet, the Ethereum Layer 2 network developed by StarkWare, today announced strkBTC, a wrapped Bitcoin asset that introduces optional shielding while preserving full DeFi composability.