Top Crypto Losers: Tezos, Toncoin, and Polkadot at crucial levels amid US-Israel strike on Iran
- Tezos approaches a crucial support level on Monday after Sunday’s 3% decline.
- Toncoin edges higher on Monday following a 6% decline on the previous day.
- Polkadot hovers near a crucial resistance trendline, with 3% gains on Monday, recovering after nearly 8% losses on Sunday.

Altcoins such as Tezos, Toncoin, and Polkadot rank among the worst hit cryptocurrencies over the last 24 hours amid the US and Israel's attack on Iran. Tezos and Toncoin are down to crucial support levels while Polkadot remains near a crucial resistance trendline, showcasing underlying strength. Technically, the broader cryptocurrency market is spooked by rising tensions in the Middle East and could extend downside risk.
Tezos under pressure risks further losses
Tezos dropped over 3% on Sunday as the 50-day Exponential Moving Average (EMA) capped the intraday gains. At the time of writing, XTZ is trading below $0.40 on Monday, approaching the February 6 low at $0.3582.
The Moving Average Convergence Divergence (MACD) remains in positive territory on the daily chart but has started to flatten, suggesting a loss in momentum and increasing the risk of a bearish crossover with its signal line. The Relative Strength Index (RSI) at 37 stays below the midline, indicating that sellers retain control.
If XTZ breaks below the recent swing low of $0.3582, it would expose the S1 Pivot Point at $0.3312.
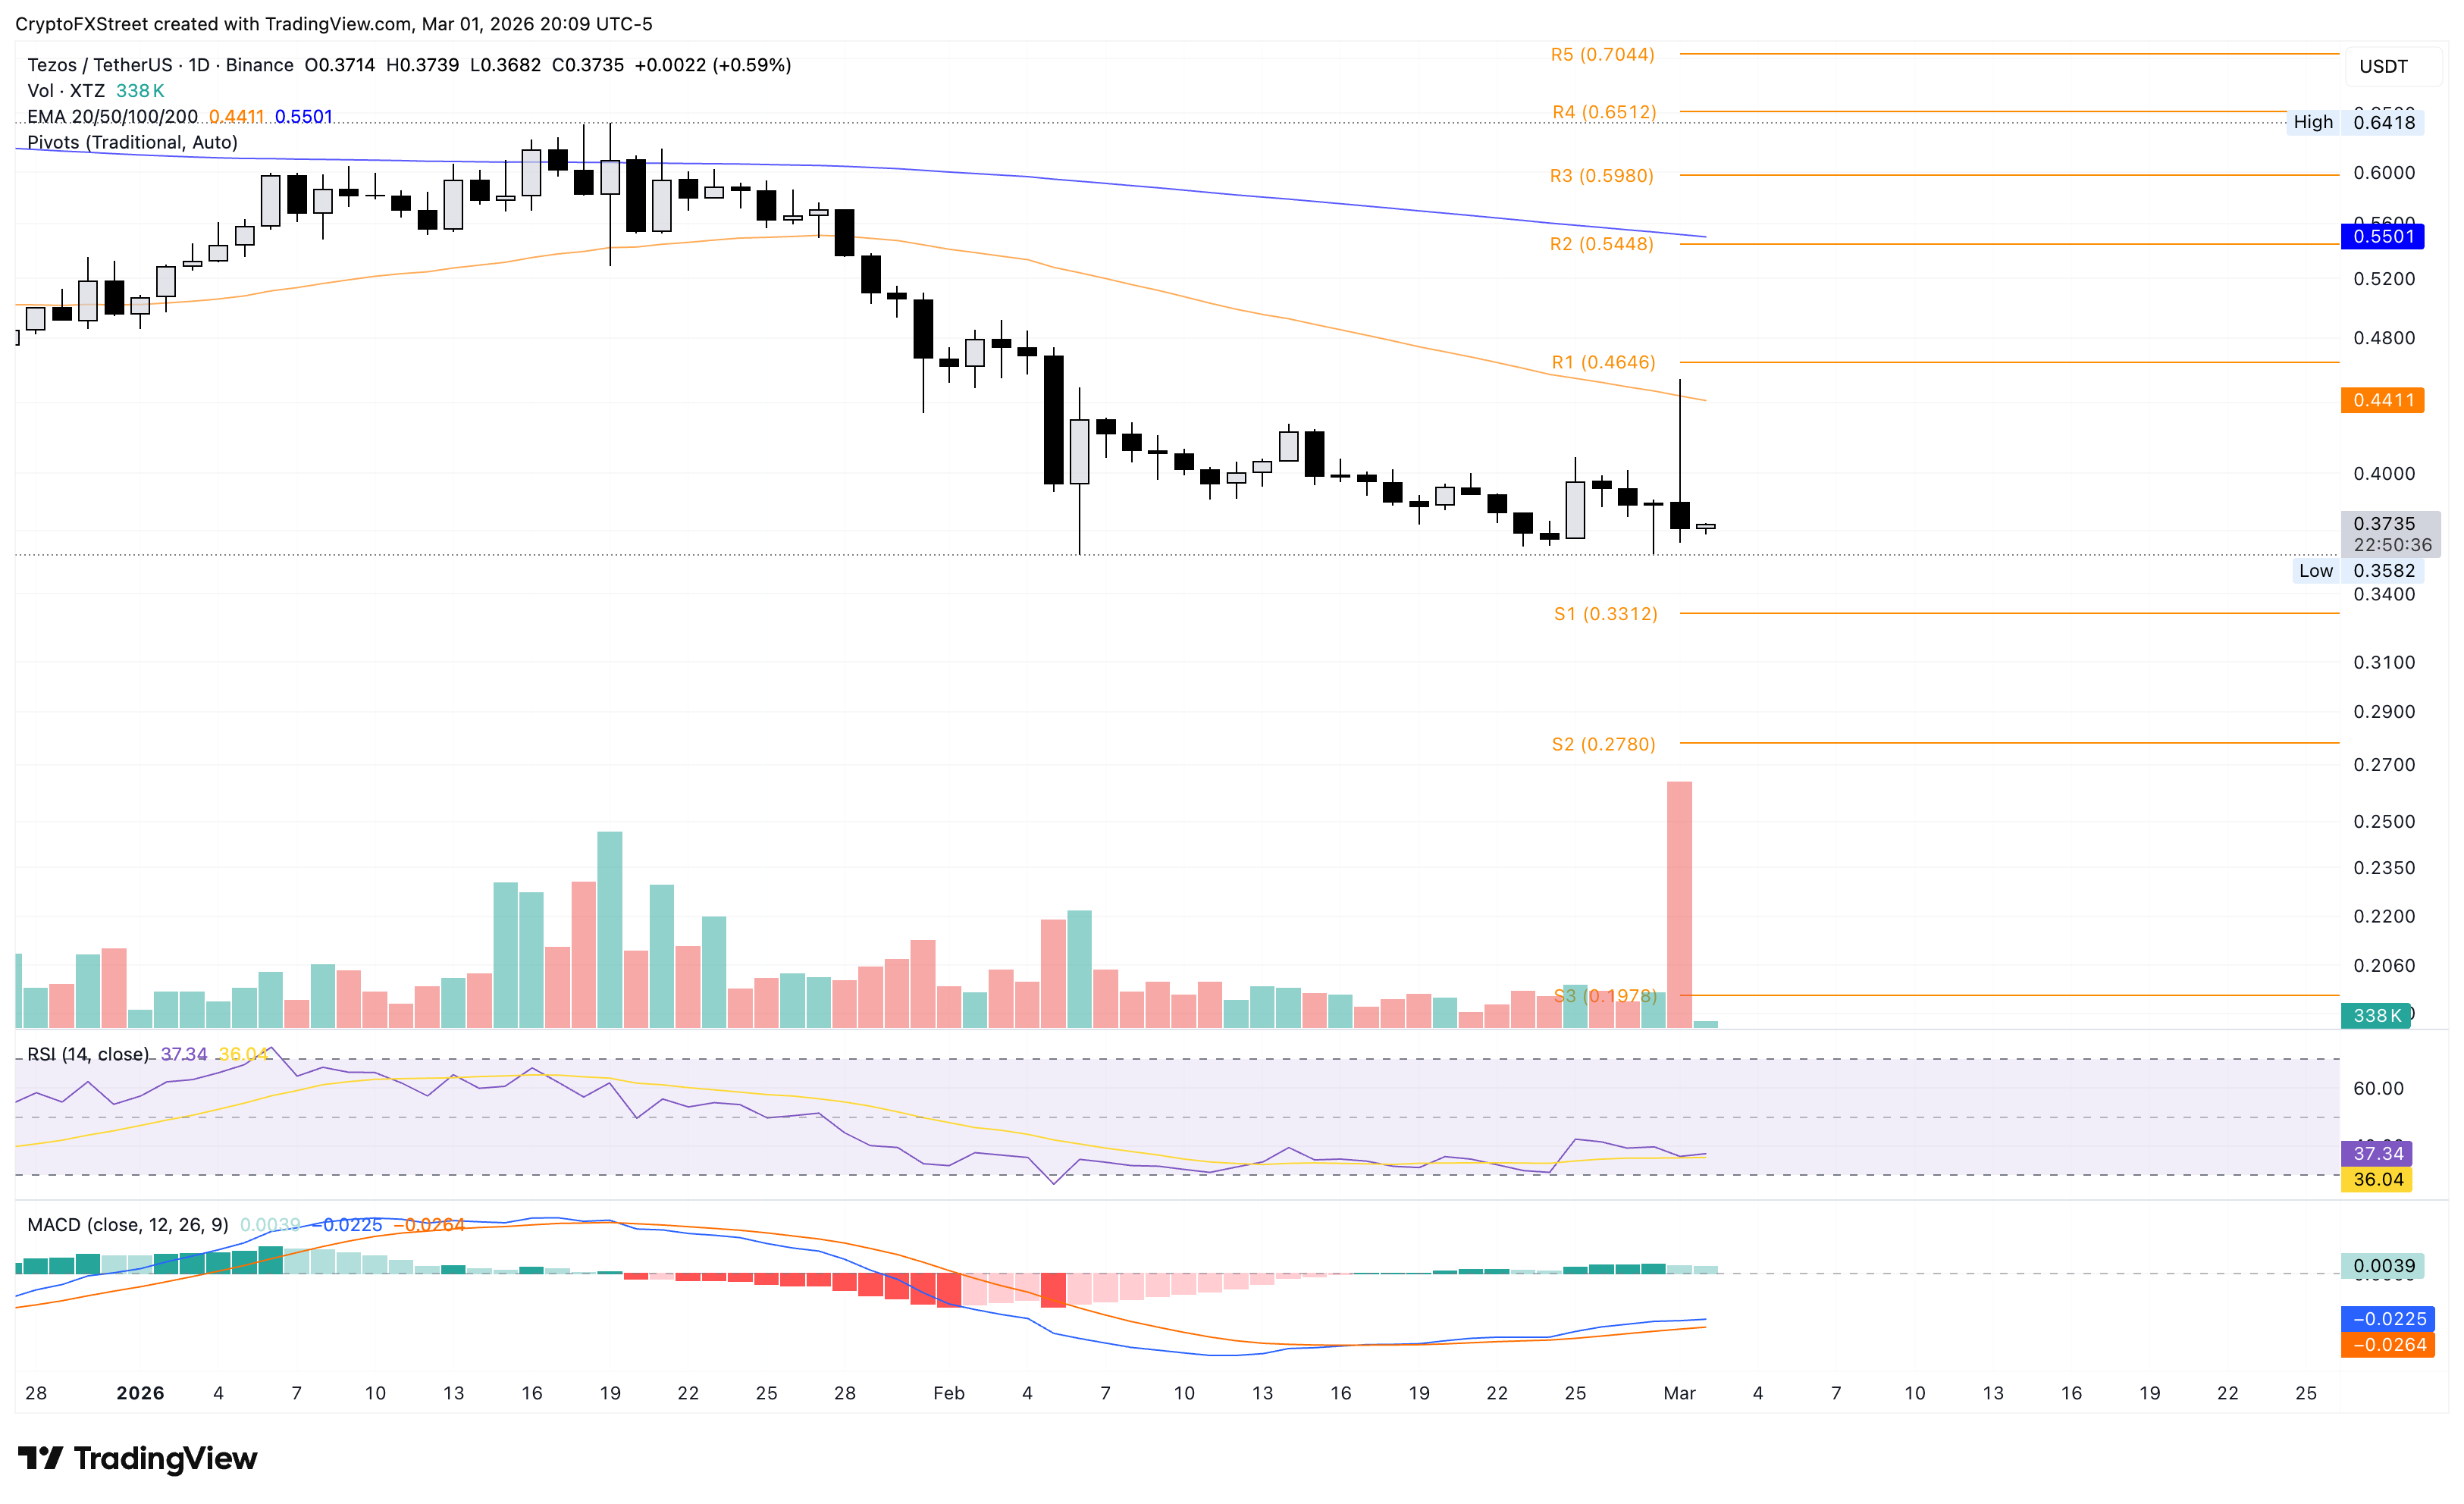
On the upside, initial resistance stands at the 50-day EMA at $0.4411.
Toncoin flashes downside risk
Toncoin extended its broader two-week decline with over 6% losses on Sunday. At the time of writing, TON shows a minor 1% recovery on Monday, holding ground near the $1.20 mark.
The near-term bias is mildly bearish as price extends its decline beneath the 50-day exponential moving average near $1.43 and remains well below the downward-sloping 200-day exponential moving average around $1.96, keeping the broader trend under pressure.
The MACD line slips further below the signal line into negative territory, while the expanding negative histogram signals strengthening bearish momentum. The RSI at 32 reinforces persistent selling pressure.
The path of least resistance for TON targets the S1 Pivot Point at $1.095 as an immediate support level.
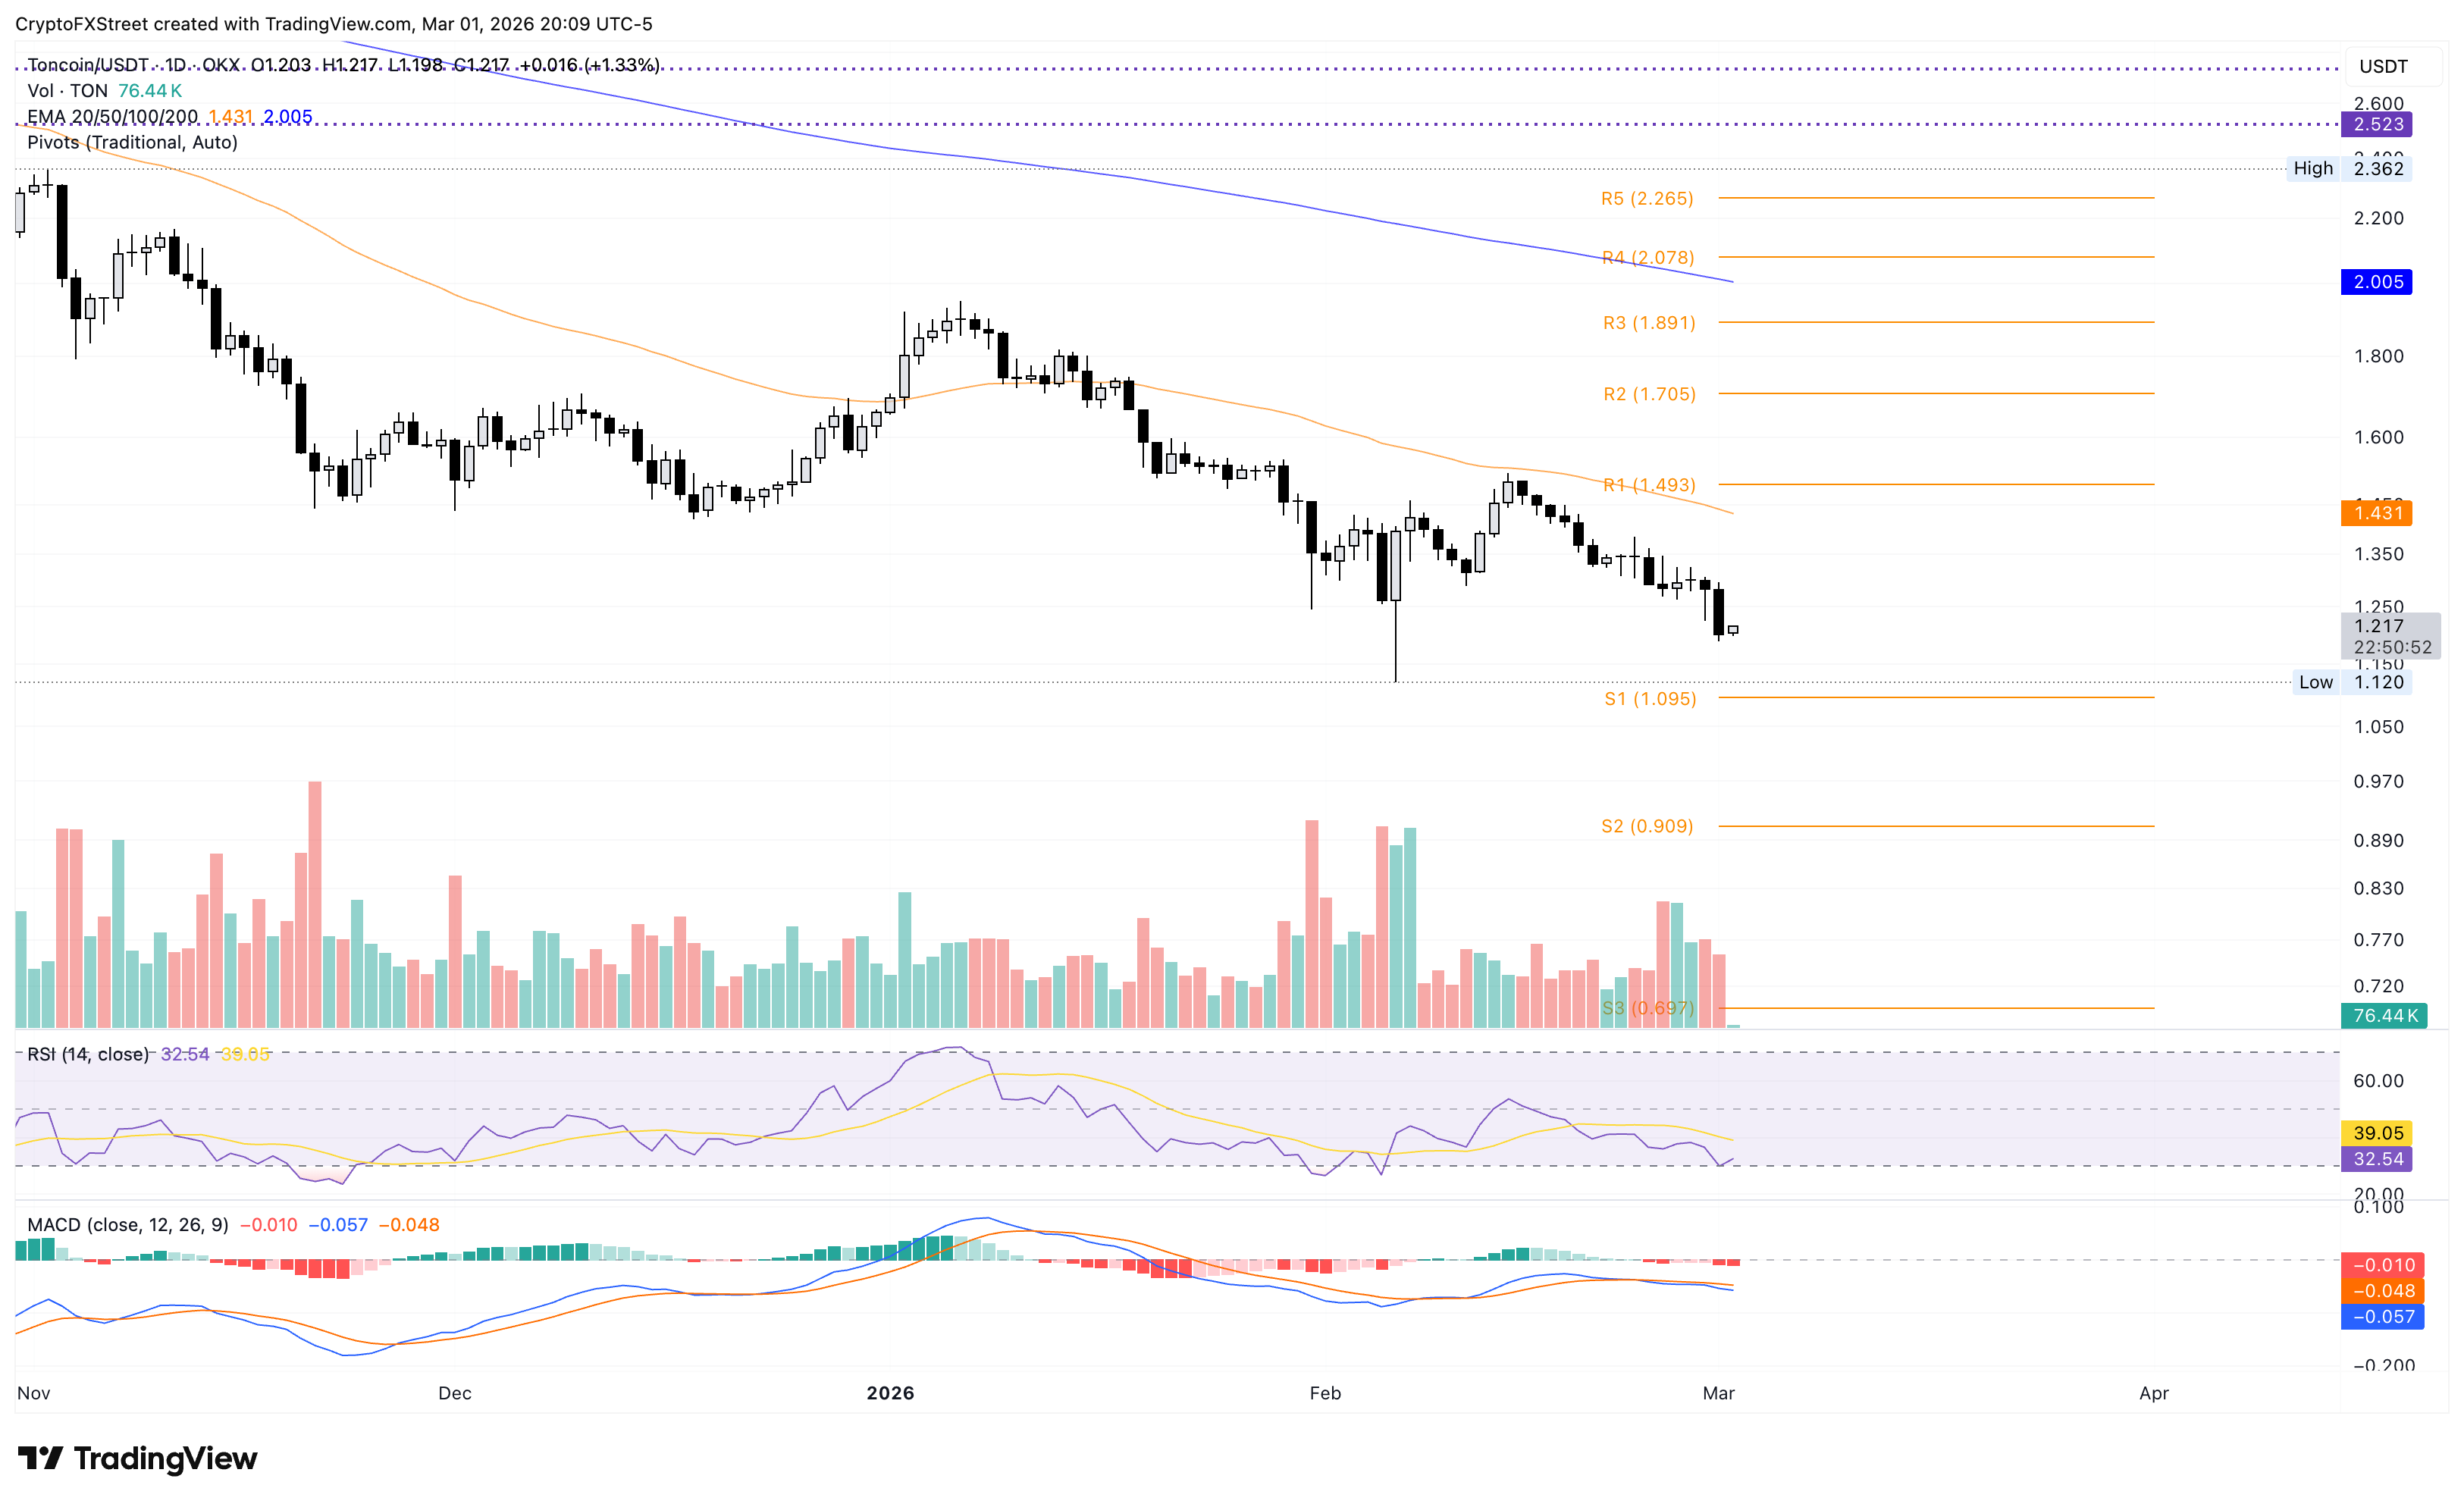
To reinforce recovery, Toncoin should reclaim the $1.30 mark to test the 50-day EMA at $1.431.
Polkadot holds ground near the crucial resistance trendline
Polkadot is up 3% at press time on Monday, recovering after nearly 8% losses the previous day. DOT holds near the 50-day EMA at $1.603, close to a descending trendline connecting the October 6 and January 13 highs, which is part of a broader descending broadening wedge pattern.
The MACD stays above its signal line and above the zero line, and the Relative Strength Index at 55 shows moderate positive momentum, maintaining a mild bullish near-term bias.
A negative close to the day could reaffirm downside pressure, putting focus on the S1 Pivot Point at $1.258.
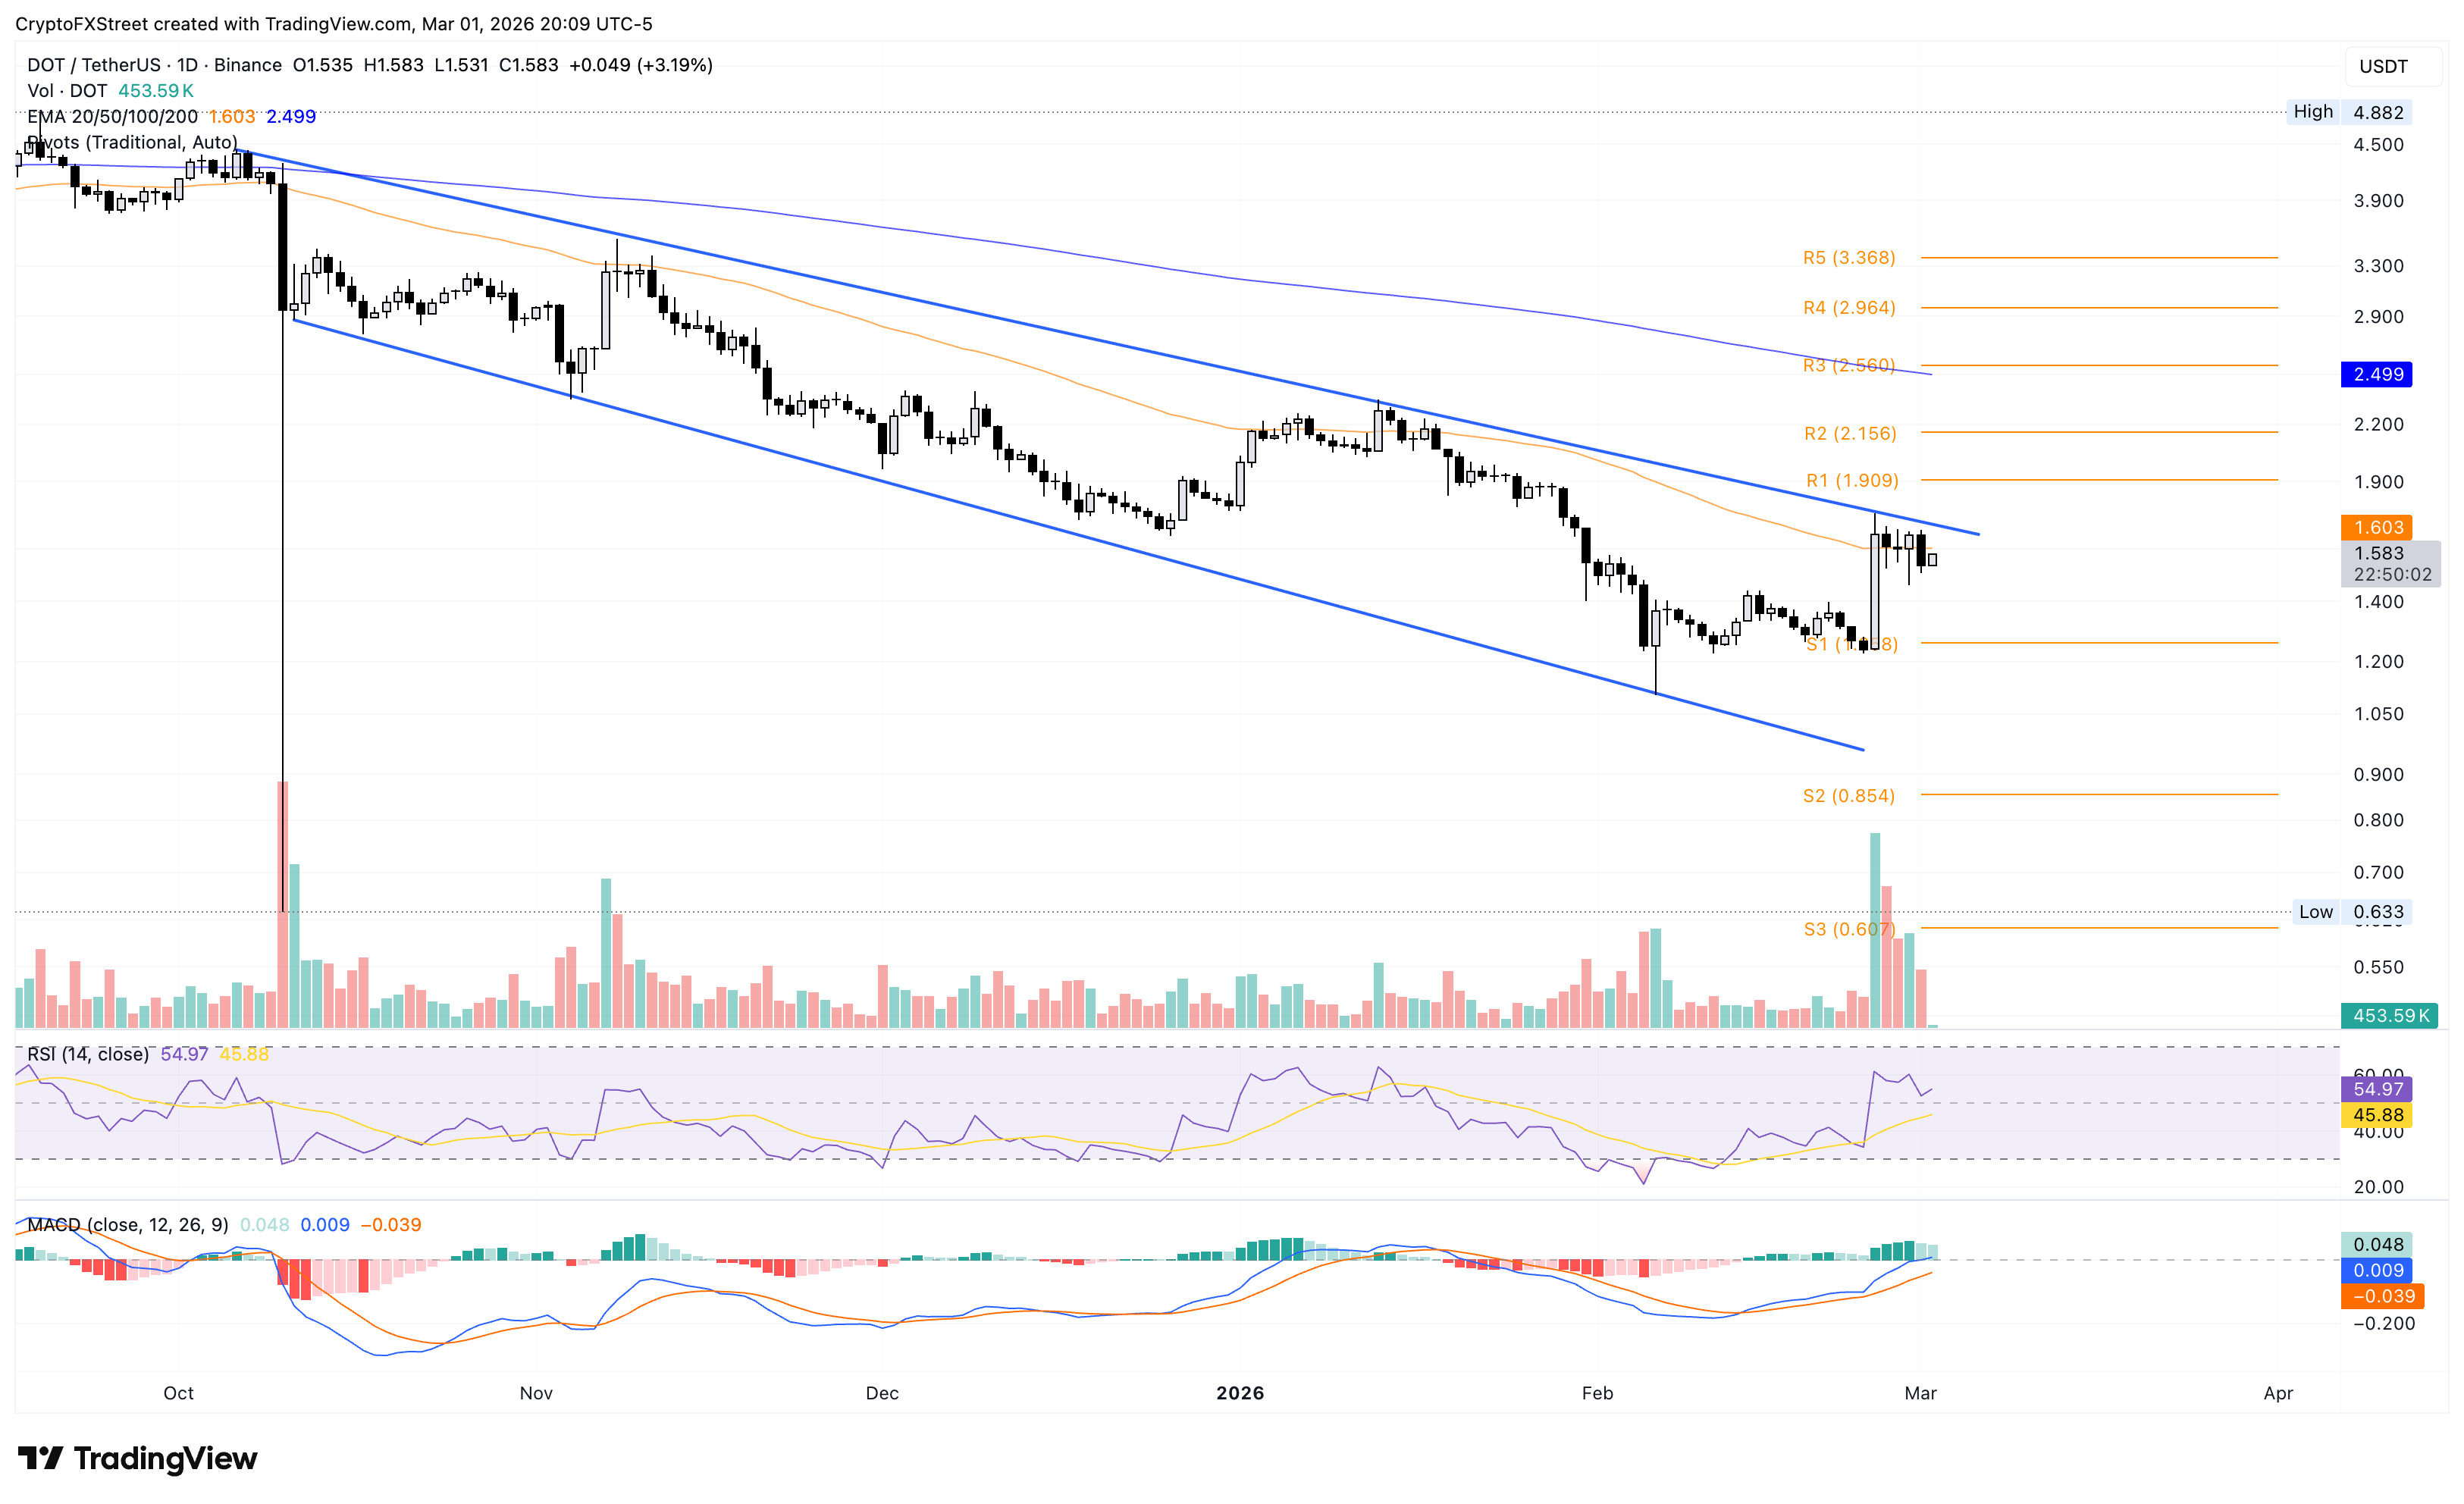
However, a breakout of the overhead trendline near $1.705 could target the S1 Pivot Point at $1.909.
(The technical analysis of this story was written with the help of an AI tool.)
Author

Vishal Dixit
FXStreet
Vishal Dixit holds a B.Sc. in Chemistry from Wilson College but found his true calling in the world of crypto.