|

GBP/JPY Price Analysis: Break of 5-DMA directs sellers to monthly support

  • GBP/JPY extends the previous day’s losses from 12-day top.
  • Downside break of short-term moving average (MA) joins receding RSI.
  • Monthly peak adds to the upside barrier beyond the weekly top.

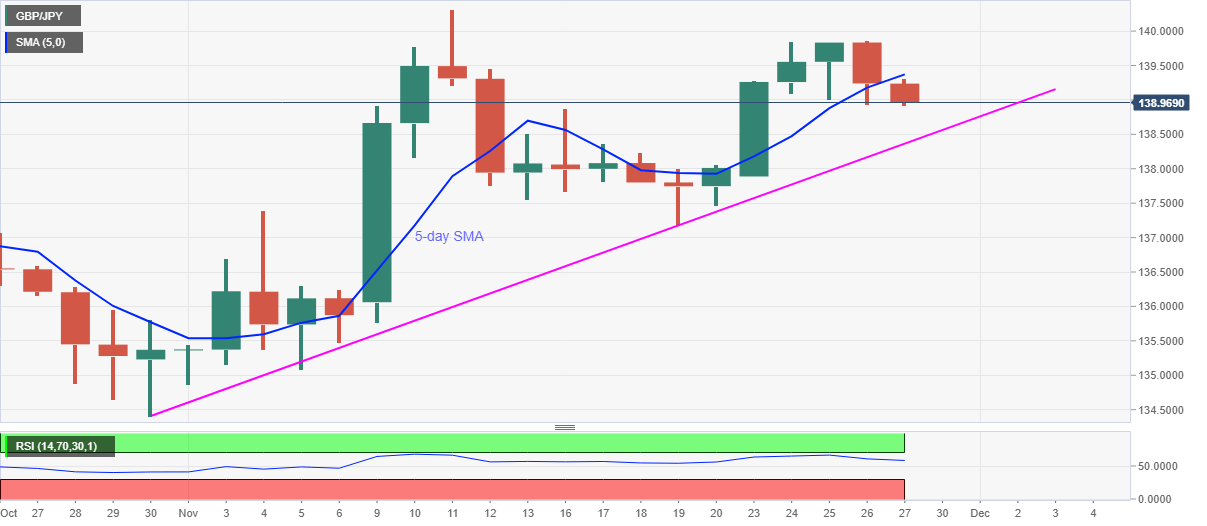
GBP/JPY bears attack 139.00, currently down 0.20% on a day near 138.95, during the pre-UK open trading on Friday. The pair surged to the highest since November 11, before declining from 139.85, the previous day.

The declines recently broke 5-day SMA (DMA) support, amid a downward sloping RSI line, which in turn suggests the quote’s further weakness towards an ascending trend line from October 30, at 138.35 now.

If at all the bears dominate past-138.35, the 138.00 round-figure and November 19 low near 137.20 will become their favorites.

Meanwhile, an upside clearance of a 5-day SMA level near 139.40 will not only need to cross the weekly top surrounding 139.85 but also the 140.00 threshold to aim for the monthly top near 140.35.

It should be noted that the pair’s sustained run-up beyond will not hesitate to challenge 141.00 whereas any further rise may look towards the yearly top near 142.70.

GBP/JPY daily chart

Trend: Further weakness expected

Additional important levels

Overview
Today last price138.96
Today Daily Change-0.28
Today Daily Change %-0.20%
Today daily open139.24
 
Trends
Daily SMA20137.79
Daily SMA50136.76
Daily SMA100137.32
Daily SMA200135.66
 
Levels
Previous Daily High139.86
Previous Daily Low138.93
Previous Weekly High138.87
Previous Weekly Low137.2
Previous Monthly High137.86
Previous Monthly Low134.41
Daily Fibonacci 38.2%139.29
Daily Fibonacci 61.8%139.5
Daily Pivot Point S1138.83
Daily Pivot Point S2138.42
Daily Pivot Point S3137.9
Daily Pivot Point R1139.75
Daily Pivot Point R2140.27
Daily Pivot Point R3140.68

Author

Anil Panchal

Anil Panchal

FXStreet

Anil Panchal has nearly 15 years of experience in tracking financial markets. With a keen interest in macroeconomics, Anil aptly tracks global news/updates and stays well-informed about the global financial moves and their implications.

More from Anil Panchal
Share:

Editor's Picks

EUR/USD looks to regain the 200-day SMA

EUR/USD regains some balance and trade just above 1.1600 the figure ahead of the opening bell in Asia. The pair initially dipped to the 1.1530 zone for the first time since November, always following the stronger US Dollar and the marked flight-to-safety in the context of the ongoing Middle East crisis
 

GBP/USD slips below key averages as geopolitical risks mount

GBP/USD fell about 0.35% on Tuesday, settling around 1.3350 after slipping below the 200-day Exponential Moving Average for the first time since early December. The pair has pulled back sharply from its late-January high near 1.3870, shedding over 500 pips in a series of lower highs and lower lows. 

Gold falls to near $5,100 as inflation fears weigh amidst Middle East conflict

Gold price faces some selling pressure near $5,100 during the early Asian session on Wednesday. The precious metal falls amid a renewed US Dollar demand and dimming prospects for US rate cuts. The US ISM Services Purchasing Managers Index report will be published later on Wednesday. 

Ethereum: Whales step up buying as short positions contract

After holding firm heading into the last weekend, Ethereum whales have returned to action, pouncing on the volatility stemming from escalating military actions between the US and Iran.

Energy shock 2.0: Why rising Gas prices could hit the Euro

Even without a confirmed, sustained disruption, the mere risk to a key global energy chokepoint is enough to inject a significant premium into European Gas markets. And for the Euro, that matters.

Ripple falters amid sell-off jitters and negative funding rates

Ripple (XRP) has come under pressure, drifting lower to $1.35 at the time of writing on Tuesday. The over 2% correction looks poised to erase the previous day’s gains, which lifted the remittance token to $1.42.