|

GBP/JPY Price Analysis: Bears resist to return even as bulls retreat from 167.50 hurdle

  • GBP/JPY snaps two-day uptrend, struggles around 1.5-month-old resistance line, 200-SMA and weekly horizontal hurdle.
  • Sluggish MACD signals, one-week-old support line restrict seller’s entry.
  • Bulls need to cross 167.50 to aim for double tops around 169.00.

GBP/JPY remains mildly offered around 167.00 as it jostles with the short-term key hurdles during Friday. In doing so, the cross-currency pair snaps a two-day uptrend but stays on the way to weekly gains.

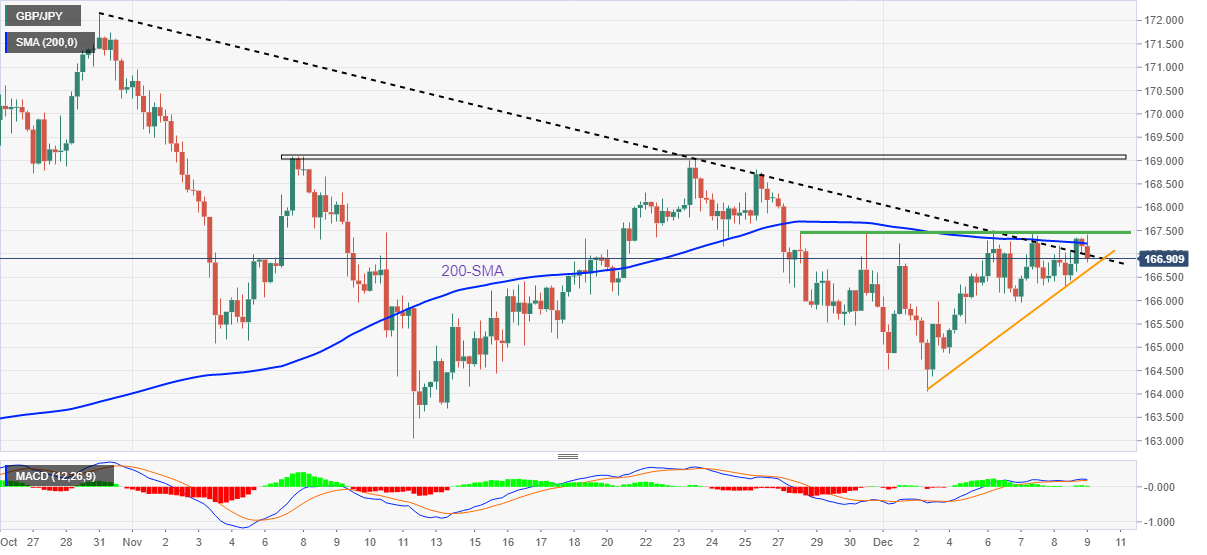
That said, GBP/JPY currently pokes the resistance-turned-support line from October 31, around 166.90 while reversing from the 200-SMA resistance of 167.22. Also challenging the pair buyers is the horizontal area comprising multiple tops marked since November 28, near 167.50.

It’s worth noting, however, that the sluggish MACD signals and an upward-sloping support line from the last Friday, around 166.60, restrict the GBP/JPY bear’s entry.

Following that, the 165.50 could act as an intermediate halt before directing the pair towards the monthly low near 164.00.

In a case where the GBP/JPY bears keep the reins past 164.00, the previous monthly trough surrounding 163.00 will be in focus.

On the contrary, a clear upside break of the 167.50 resistance will quickly propel the prices toward the one-month-old horizontal resistance zone near 169.00-10.

Should the GBP/JPY buyers manage to cross the 169.10 upside barrier, the odds of their rush toward the late October peak near 172.15 can’t be ruled out.

GBP/JPY: Four-hour chart

Trend: Further downside expected

Additional important levels

Overview
Today last price166.96
Today Daily Change-0.32
Today Daily Change %-0.19%
Today daily open167.28
 
Trends
Daily SMA20166.44
Daily SMA50166.47
Daily SMA100164.41
Daily SMA200163.14
 
Levels
Previous Daily High167.35
Previous Daily Low166.29
Previous Weekly High168.29
Previous Weekly Low164.05
Previous Monthly High170.95
Previous Monthly Low163.06
Daily Fibonacci 38.2%166.95
Daily Fibonacci 61.8%166.7
Daily Pivot Point S1166.6
Daily Pivot Point S2165.91
Daily Pivot Point S3165.53
Daily Pivot Point R1167.66
Daily Pivot Point R2168.04
Daily Pivot Point R3168.72

Author

Anil Panchal

Anil Panchal

FXStreet

Anil Panchal has nearly 15 years of experience in tracking financial markets. With a keen interest in macroeconomics, Anil aptly tracks global news/updates and stays well-informed about the global financial moves and their implications.

More from Anil Panchal
Share:

Editor's Picks

EUR/USD loses traction after earlier rebound, tests 1.1600

EUR/USD fails to preserve its recovery momentum after rising toward 1.1650 earlier in the day and tests 1.1600. The risk-averse market atmosphere amid the widening conflict in the Middle East and the broad-based US Dollar strength make it difficult for the pair to hold its ground.

GBP/USD stays weak near 1.3350 amid UK stagflation risks

GBP/USD stays in negative territory near 1.3350 in the second half of the day Thursday. The Pound Sterling loses ground amid fears that the United Kingdom economy could face stagflation risks due to higher energy prices, while the US Dollar attracts fresh safe-haven demand, weighing on the pair.

Gold struggles to benefit from risj-aversion, drops toward $5,100

Gold turns south in the American session on Thursday and declines toward $5,100. The persistent US Dollar (USD) strength doesn't allow XAU/USD to gather recovery momentum despite markets remain risks-averse due to the deepening conflict in the Middle East.

Crypto Today: Bitcoin, Ethereum, XRP hold weekly gains despite US-Iran war

The cryptocurrency market is gaining strength on Thursday, building on Wednesday's upswing, which saw Bitcoin reach a weekly high above $74,000. Ethereum and Ripple are moderating their recent gains amid uncertainty stemming from the escalating war in the Middle East.

Markets attempt to rally on positive news from Iran

There’s been an abrupt change in sentiment this morning, European stock markets are higher and oil and gas prices are moderating, after comments from Iran’s deputy minister about pre-conflict talks between Iran and the US.

Cardano Price Analysis: Approaches key trendline amid bearish sentiment

Cardano (ADA) price is approaching its descending trendline around $0.28 at the time of writing, set to shape the next directional move. The derivatives metrics paint a bearish picture, with ADA’s Open Interest continuing to fall and short bets rising among traders.