|

GBP/JPY Price Analysis: Bears flex muscles around 162.00 as BoJ looms

  • GBP/JPY keeps the previous day’s losses around two-week low, depressed of late.
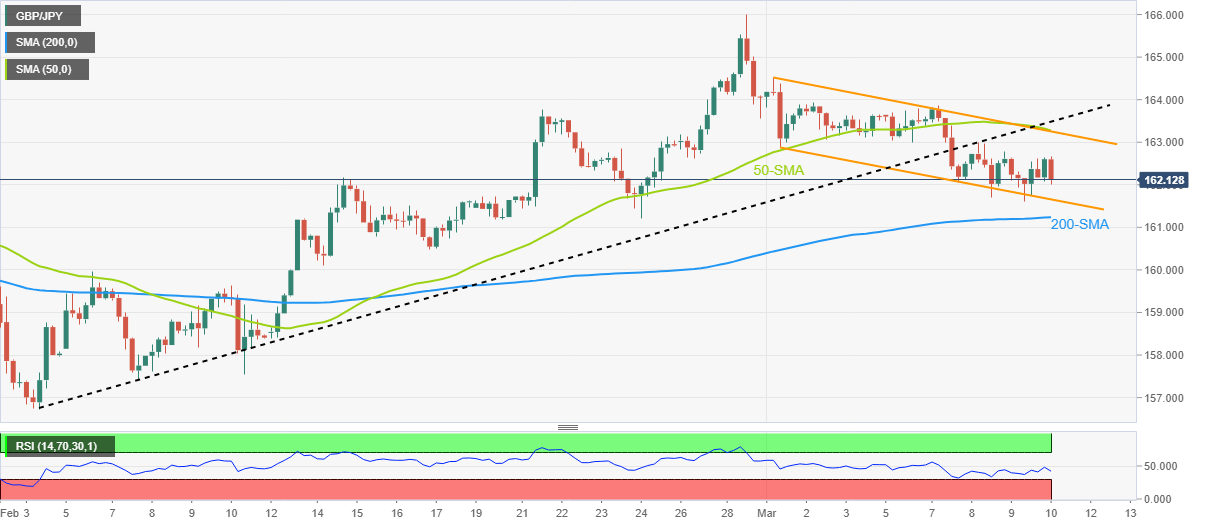
  • Monthly bearish channel, sustained trading below previous support line signals further downside.
  • 200-SMA appears the key challenge to bears amid sluggish RSI.

GBP/JPY holds lower ground at the intraday bottom surrounding 162.00 as pair traders await the all-important Bank of Japan (BoJ) monetary policy meeting announcements early Friday.

Also read: GBP/JPY rebounds from 162.00 ahead of UK Manufacturing data and BoJ policy

In doing so, the cross-currency pair remains inside a downward-sloping trend channel from March 01 while keeping the early week’s downside break of the five-week-old support-turned-resistance line.

It’s worth noting that the absence of an oversold RSI and the quote’s sustained trading below the 50-bar Simple Moving Average (SMA) adds strength to the bearish bias.

That said, the stated channel’s bottom line, around 161.65 by the press time, appears to put a floor under the GBP/JPY prices. Following that, the 200-SMA level, near 161.20 by the press time, acts as the last defense of the buyers.

In a case where GBP/JPY remains bearish past 161.20, the sellers may aim for the mid-February swing low surrounding 160.50 and the 160.00 round figure.

Alternatively, recovery moves can target the 163.00 round figure but may have a tough time crossing the 163.25-30 resistance confluence, encompassing the aforementioned channel’s top line and the 50-SMA.

Even if the quote rallies past 163.30, the previous support line from early February, near 163.50, could challenge the run-up before directing the GBP/JPY bulls towards the previous monthly peak surrounding 166.00.

GBP/JPY: Four-hour chart

Trend: Further downside expected

Additional important levels

Overview
Today last price162.13
Today Daily Change-0.10
Today Daily Change %-0.06%
Today daily open162.23
 
Trends
Daily SMA20162.3
Daily SMA50160.49
Daily SMA100163.34
Daily SMA200163.44
 
Levels
Previous Daily High162.79
Previous Daily Low161.62
Previous Weekly High166.01
Previous Weekly Low162.61
Previous Monthly High166.01
Previous Monthly Low156.73
Daily Fibonacci 38.2%162.06
Daily Fibonacci 61.8%162.34
Daily Pivot Point S1161.64
Daily Pivot Point S2161.04
Daily Pivot Point S3160.46
Daily Pivot Point R1162.81
Daily Pivot Point R2163.38
Daily Pivot Point R3163.98

Author

Anil Panchal

Anil Panchal

FXStreet

Anil Panchal has nearly 15 years of experience in tracking financial markets. With a keen interest in macroeconomics, Anil aptly tracks global news/updates and stays well-informed about the global financial moves and their implications.

More from Anil Panchal
Share:

Markets move fast. We move first.

Orange Juice Newsletter brings you expert driven insights - not headlines. Every day on your inbox.

By subscribing you agree to our Terms and conditions.

Editor's Picks

EUR/USD moves sideways below 1.1800 on Christmas Eve

EUR/USD struggles to find direction and trades in a narrow channel below 1.1800 after posting gains for two consecutive days. Bond and stock markets in the US will open at the usual time and close early on Christmas Eve, allowing the trading action to remain subdued. 

GBP/USD keeps range around 1.3500 amid quiet markets

GBP/USD keeps its range trade intact at around 1.3500 on Wednesday. The Pound Sterling holds the upper hand over the US Dollar amid pre-Christmas light trading as traders move to the sidelines heading into the holiday season. 

Gold retreats from record highs, trades below $4,500

Gold retreats after setting a new record-high above $4,520 earlier in the day and trades in a tight range below $4,500 as trading volumes thin out ahead of the Christmas break. The US Dollar selling bias remains unabated on the back of dovish Fed expectations, which continues to act as a tailwind for the bullion amid persistent geopolitical risks.

Bitcoin slips below $87,000 as ETF outflows intensify, whale participation declines

Bitcoin price continues to trade around $86,770 on Wednesday, after failing to break above the $90,000 resistance. US-listed spot ETFs record an outflow of $188.64 million on Tuesday, marking the fourth consecutive day of withdrawals.

Economic outlook 2026-2027 in advanced countries: Solidity test

After a year marked by global economic resilience and ending on a note of optimism, 2026 looks promising and could be a year of solid economic performance. In our baseline scenario, we expect most of the supportive factors at work in 2025 to continue to play a role in 2026.

Avalanche struggles near $12 as Grayscale files updated form for ETF

Avalanche trades close to $12 by press time on Wednesday, extending the nearly 2% drop from the previous day. Grayscale filed an updated form to convert its Avalanche-focused Trust into an ETF with the US Securities and Exchange Commission.